

App Guides · Trichomes
App Guide
How to Upload a Trichome Photo in GrowBotiq Lab
Upload, let the model read the trichomes, then file the result under the right environment and plant — and land straight on the plant that just got updated.
August 2026
7 min read
App Guide
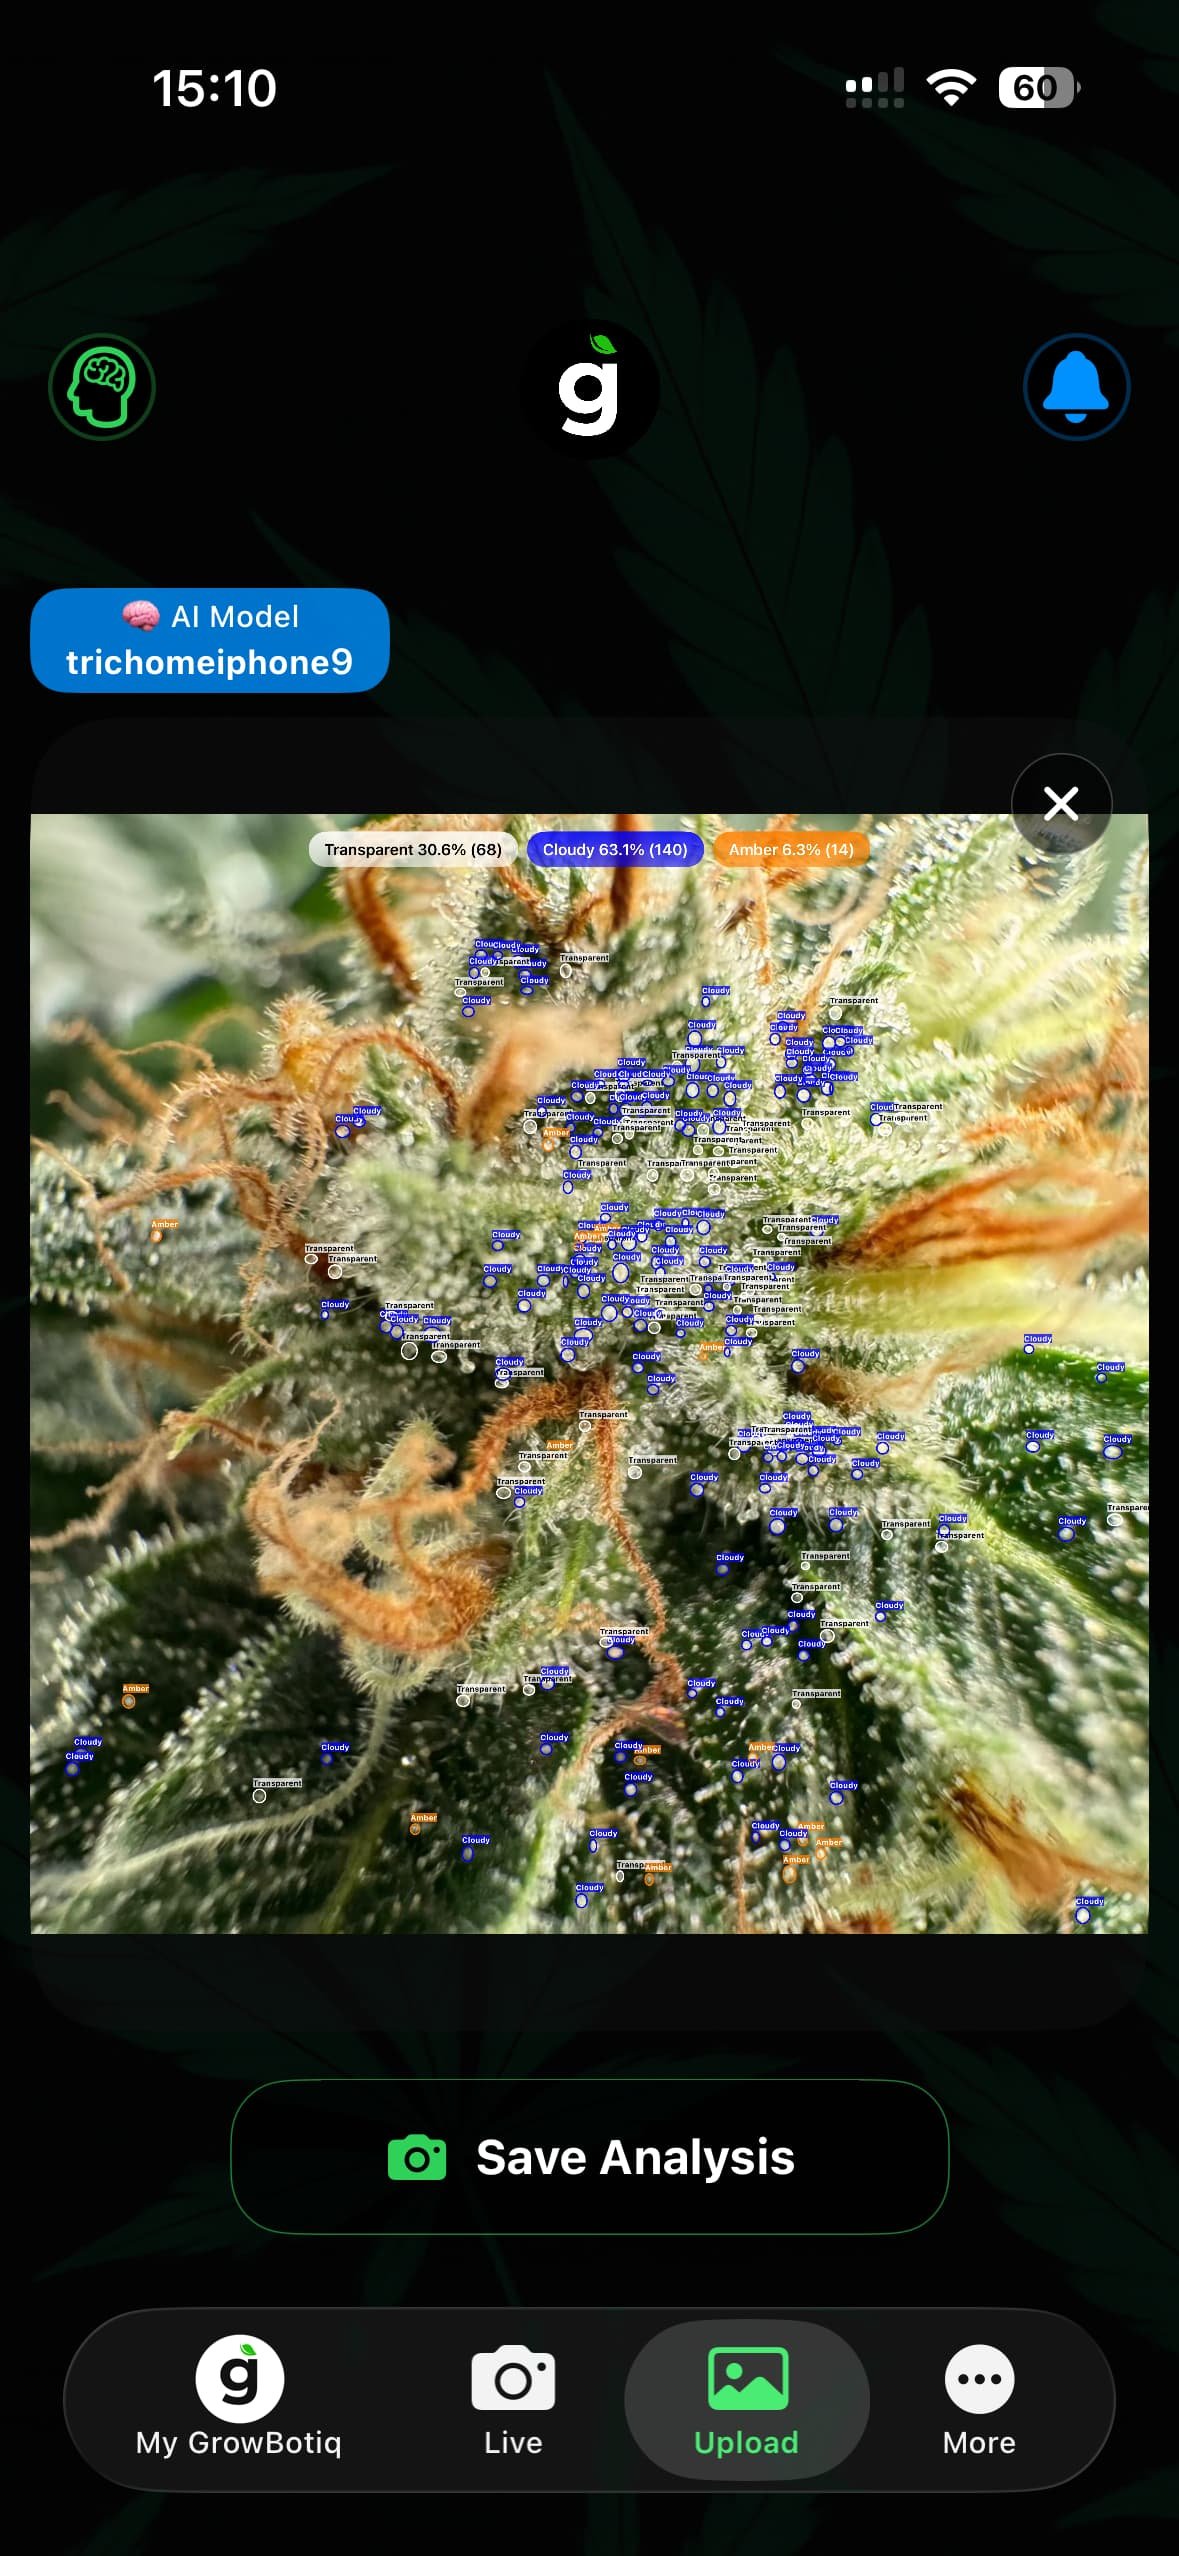
Uploading a photo to GrowBotiq Lab takes about ten seconds. You pick the image, and detection starts on its own: the model finds every trichome head in the frame, classifies each one as transparent, cloudy or amber, and gives you a maturity score — all on your iPhone, with no internet connection required.
Then you tap Save, and the app asks the only two questions that matter for your data: which environment, and which plant inside it. Confirm, and the photo plus its full trichome breakdown are filed on that plant — the app takes you straight there, with the reading already on the timeline.
That last part is what turns a one-off number into a maturity curve you can actually harvest by. Here is the full flow, screen by screen.
🔬
Not sure what the score means yet? Read When to Harvest Cannabis: Reading Trichomes for Peak Potency for the cloudy-to-amber ratios behind each effect profile.
Set Up Once: One Environment, One Plant
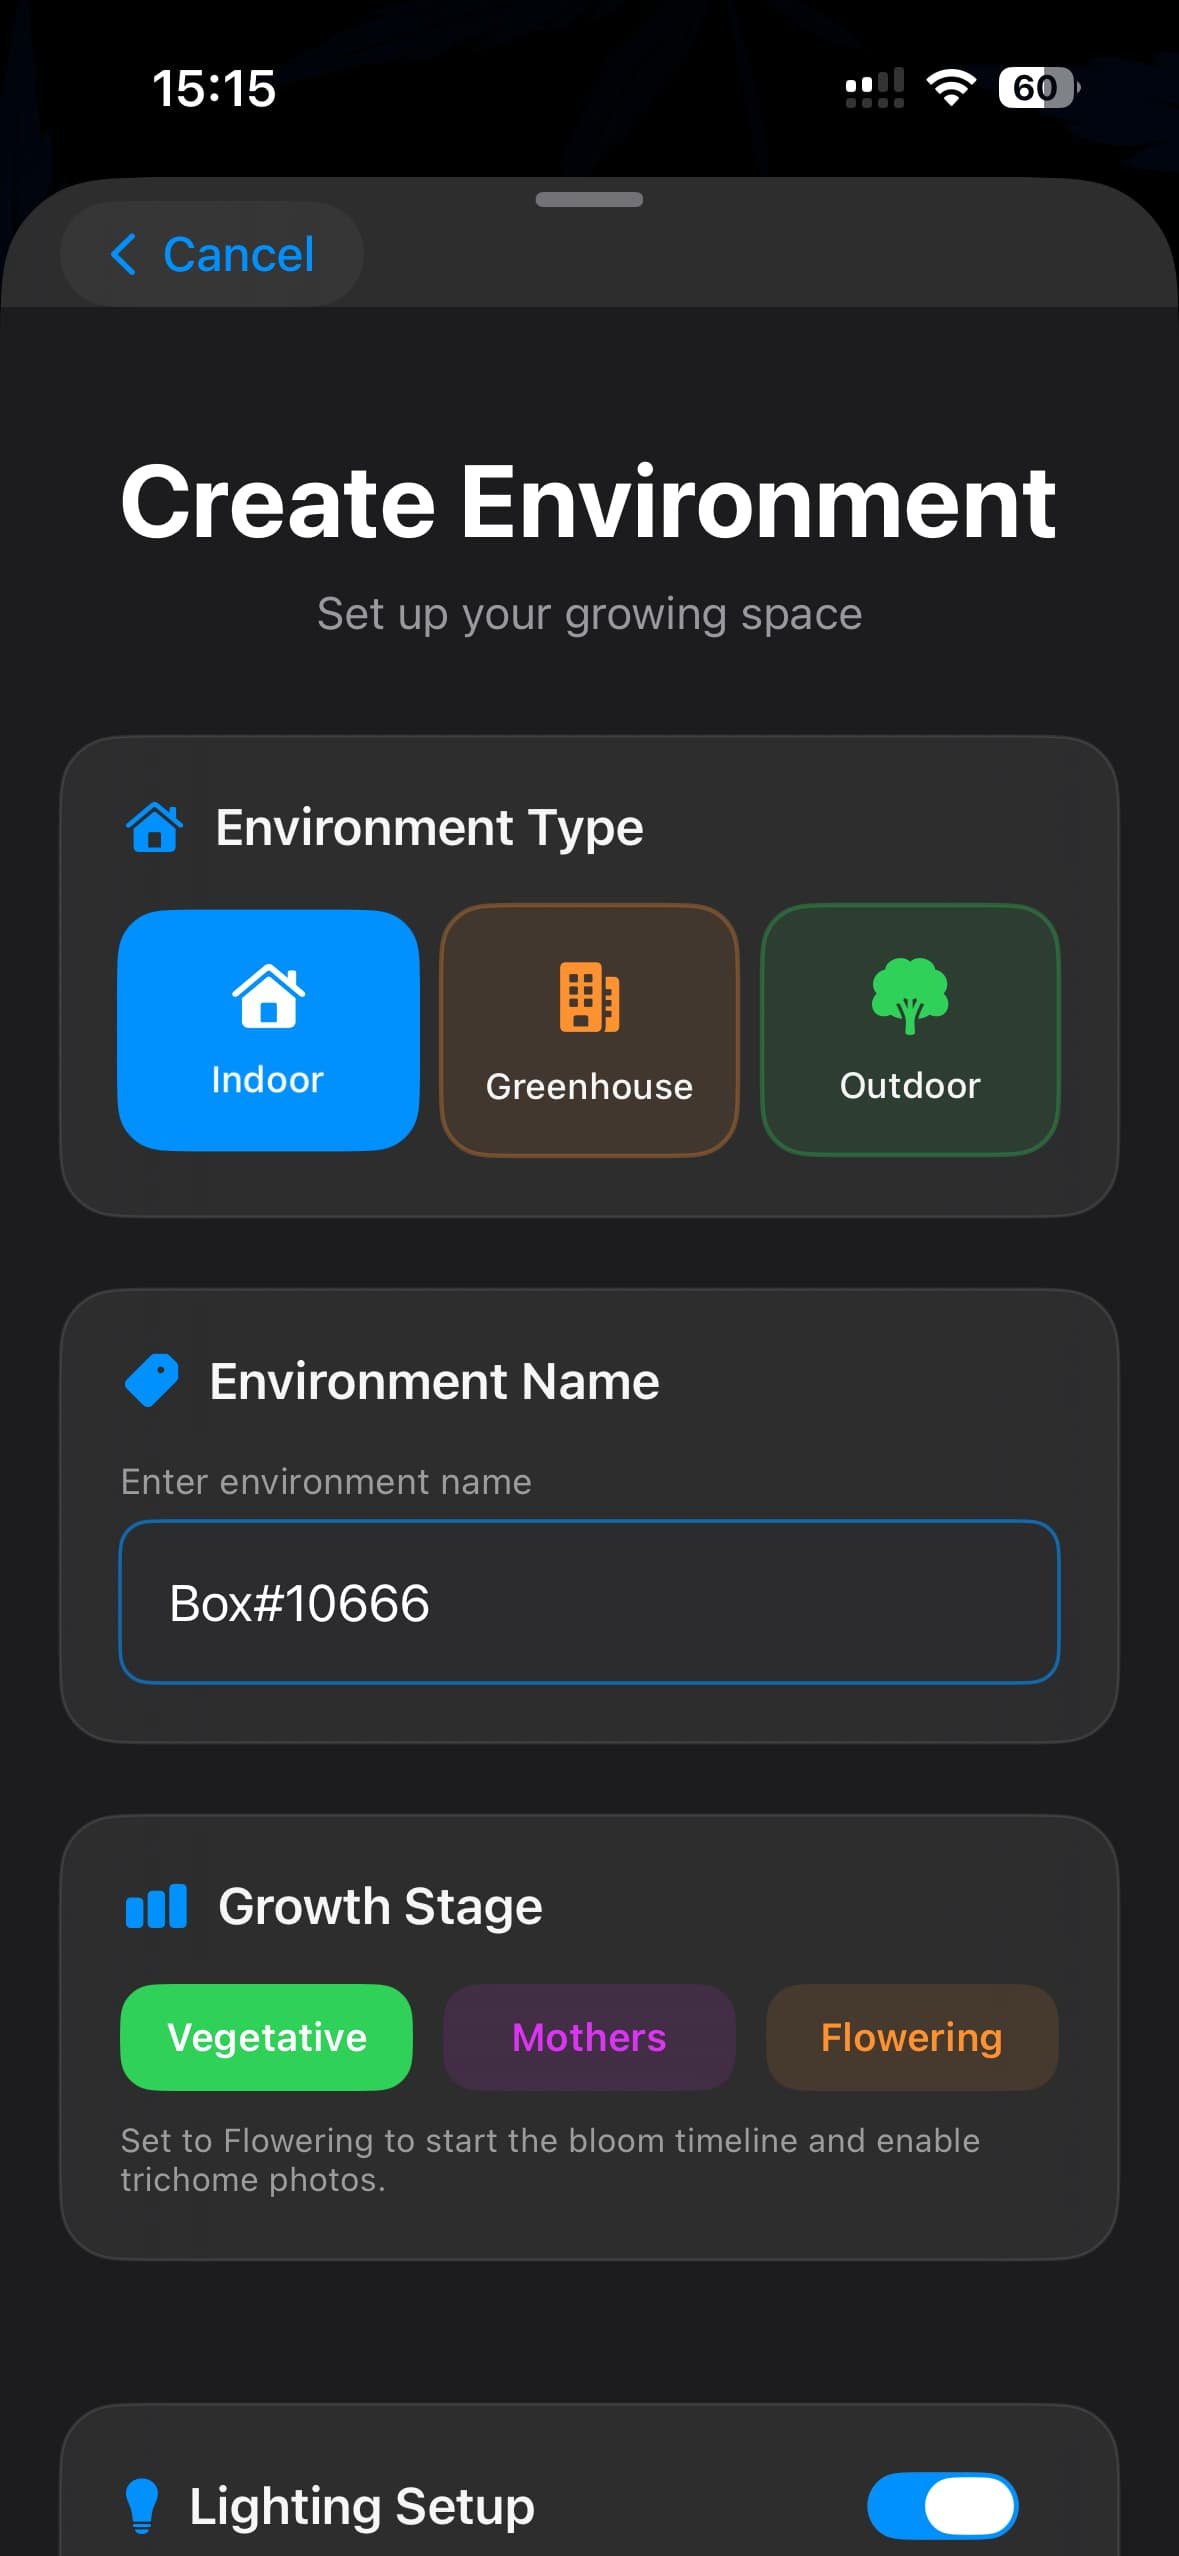
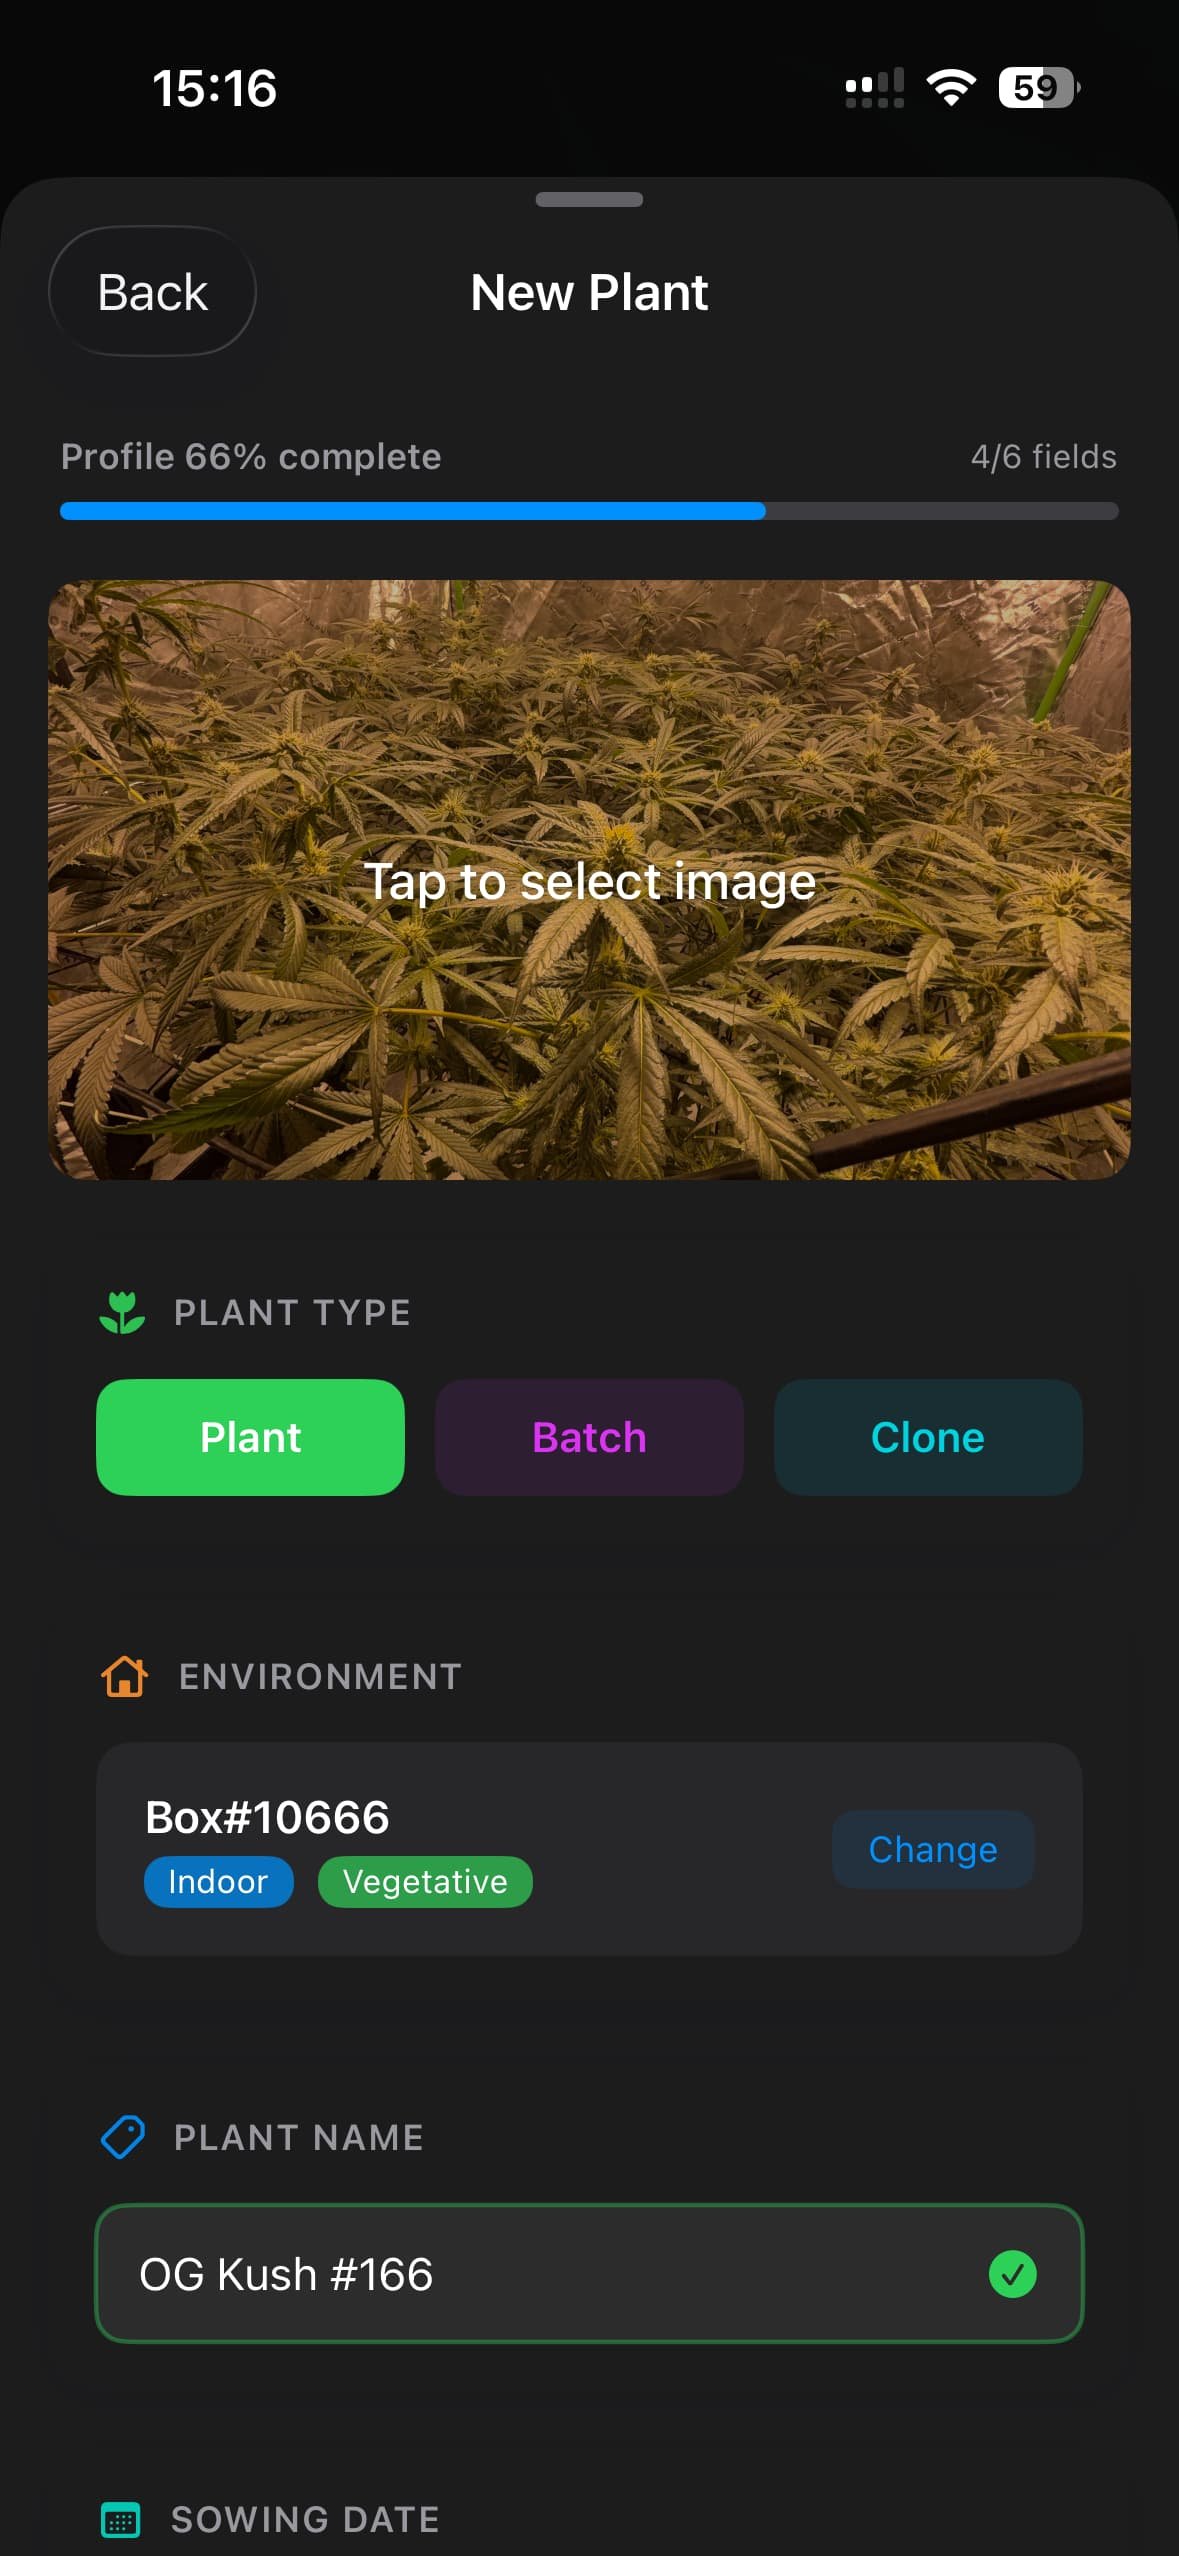
The analysis itself needs nothing — upload a photo on day one and you get a reading. Saving is where the structure comes in: the save flow asks for an environment first, then a plant inside it. So before your first upload, create one of each. It takes under a minute, and you only do it once per grow.
1. An Environment
The space itself — tent, room, greenhouse. This is where your temperature, humidity, VPD and light readings live. Every plant belongs to one environment, so the app can read what the plant is doing against the conditions it is doing it in.
2. A Plant
Created inside an environment, with its genetics, stage and grow log. Each plant carries its own trichome maturity timeline — and that timeline is exactly where your saved analysis lands.
⚠️ Nothing to save into means nothing to chart
You can run an analysis with an empty app, but you will have no environment and no plant to file it under — and the maturity curve only exists when consecutive readings are stored on the same plant. That curve, not any single percentage, is what tells you whether cloudy is still climbing or already flattening out. Create the environment and the plant first, and every upload afterwards is two taps to save.
The Upload Flow, Step by Step
Open GrowBotiq Lab and tap Upload in the tab bar
The Upload tab sits in the bottom tab bar, alongside your plants, environments and logs. It is the entry point for every trichome analysis — no menus to dig through.
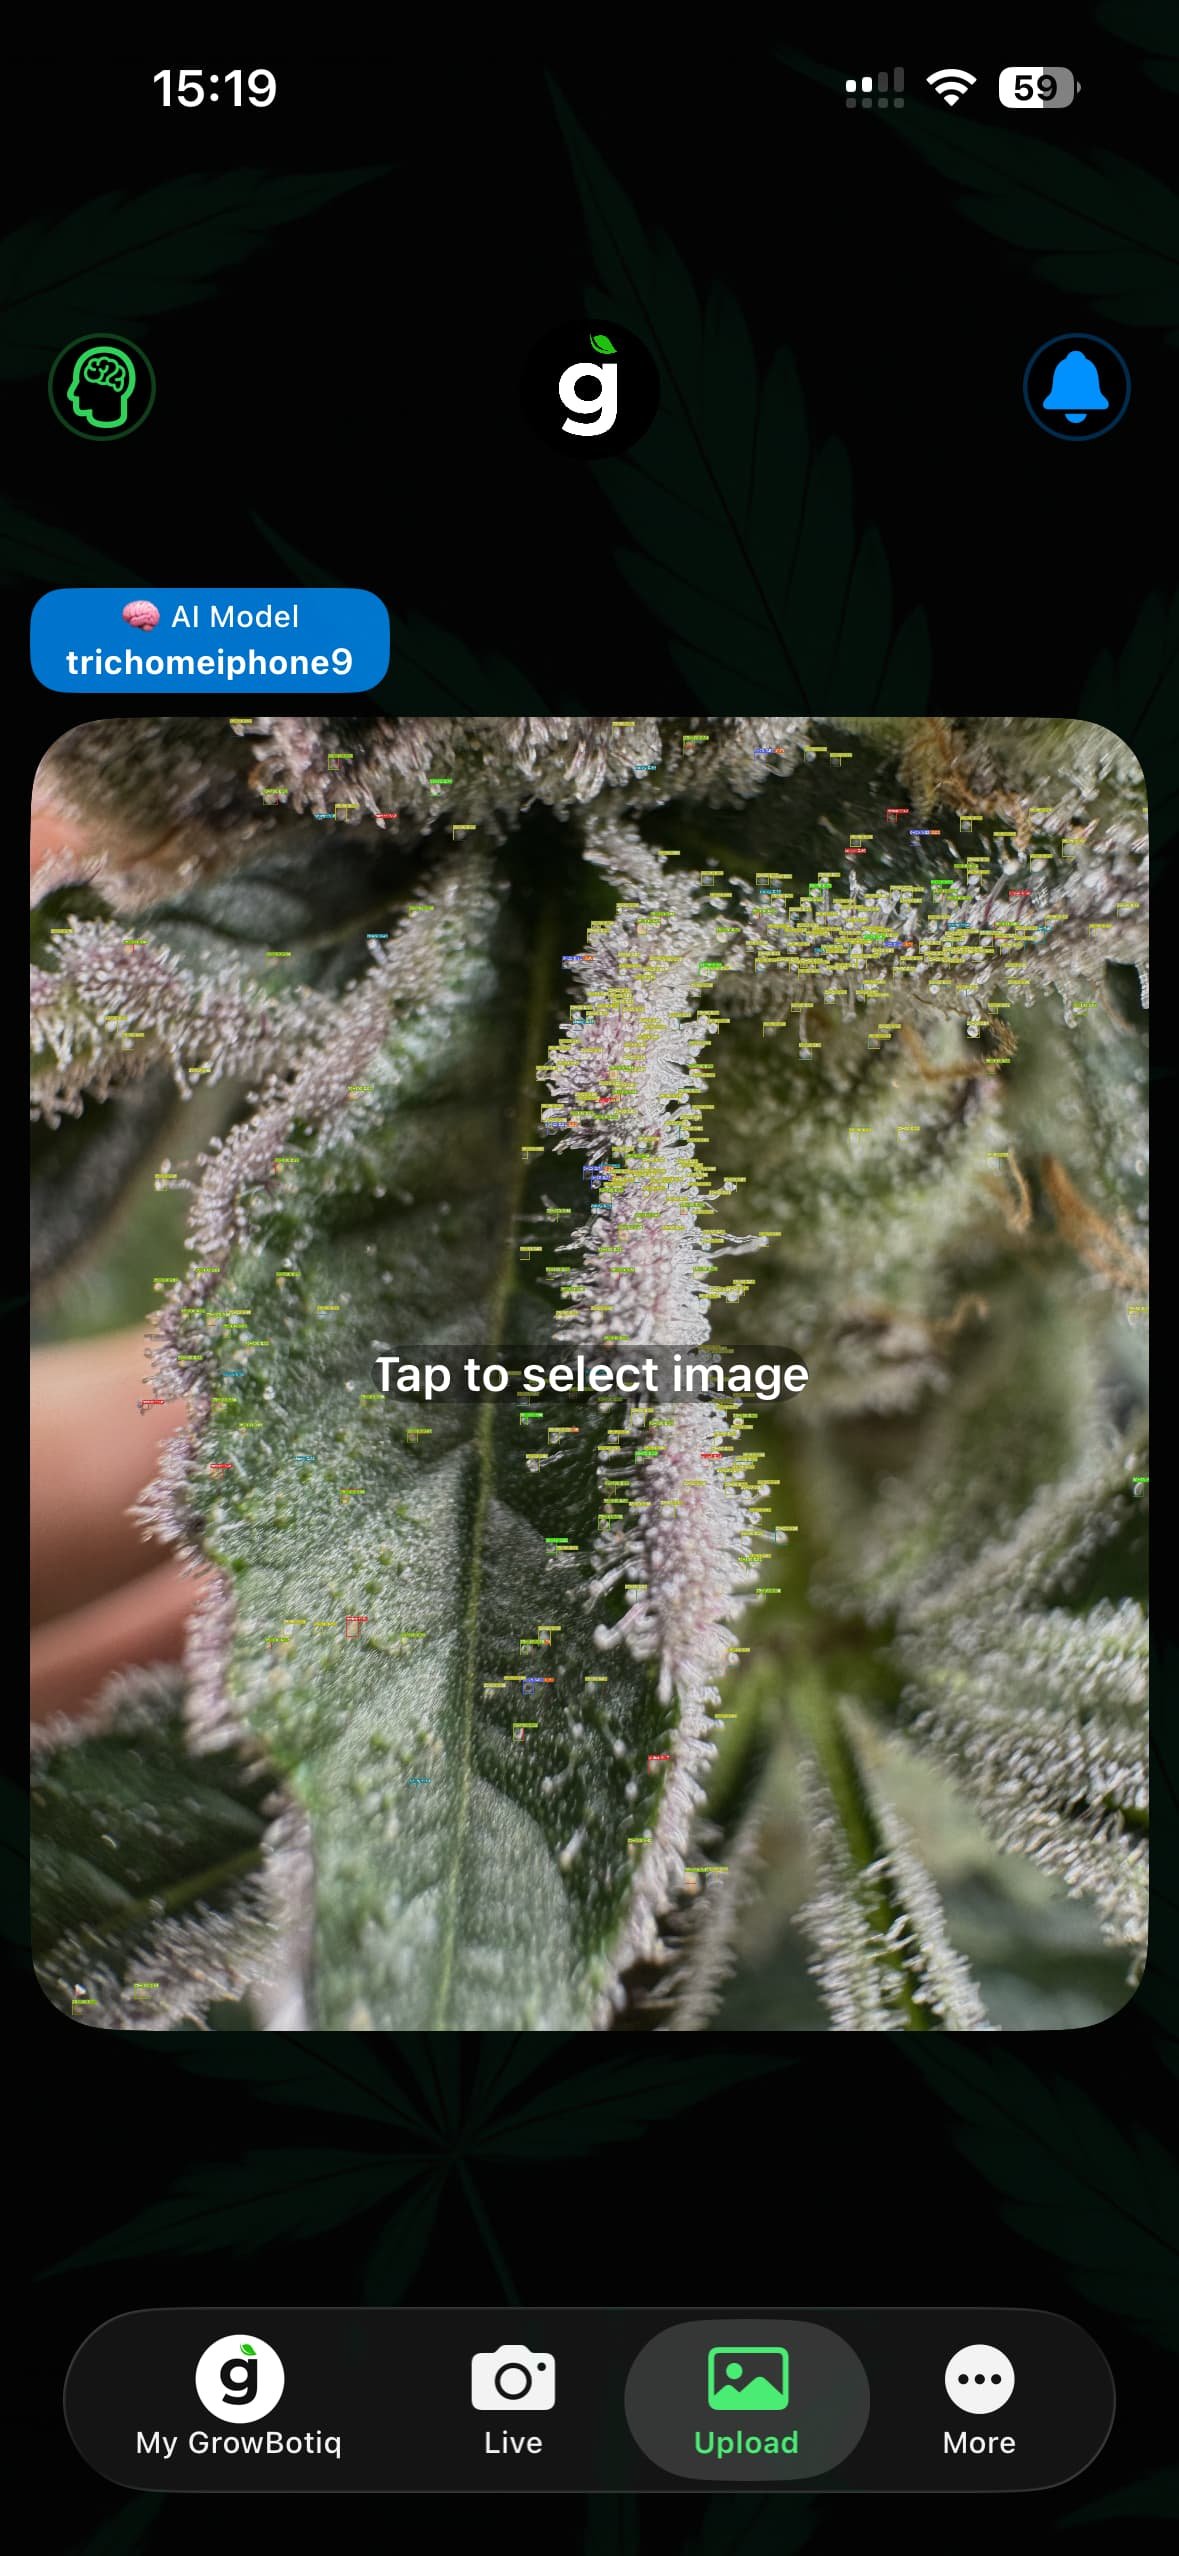
Select the photo — detection runs by itself
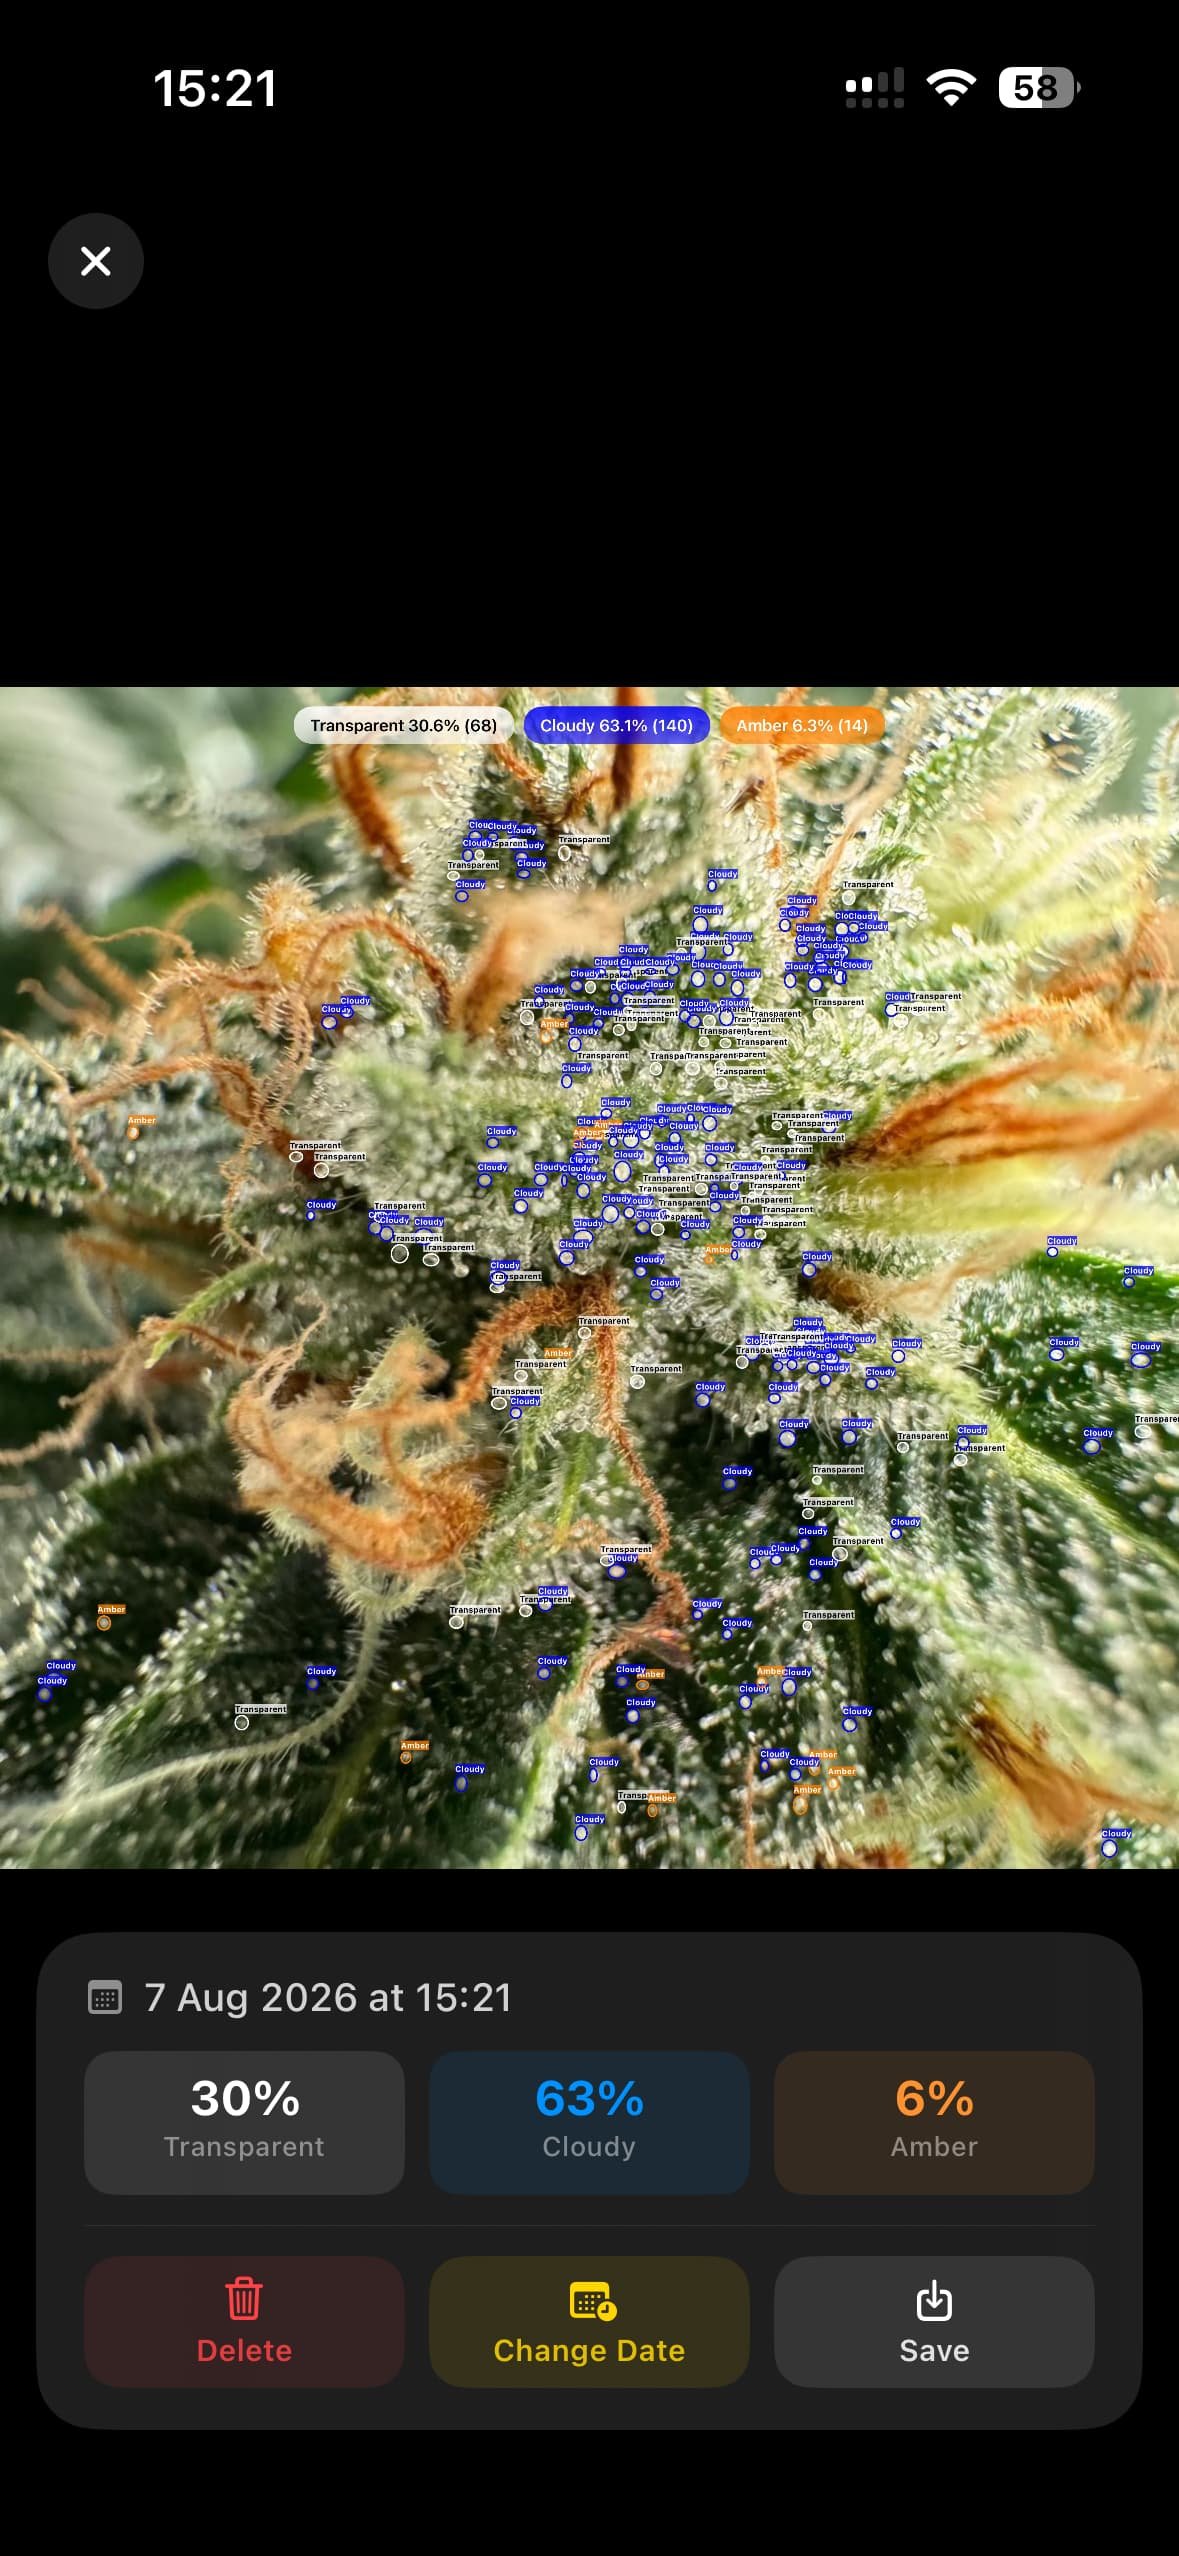
Pull a macro shot from your photo library or take one on the spot. There is no button to press afterwards: as soon as the image loads, the model finds every trichome head and classifies it as transparent, cloudy or amber. Detection runs locally on the Neural Engine, so the photo never leaves your iPhone and the grow room does not need Wi-Fi.
What comes back is a percentage split across the three stages plus an overall maturity score. Compare it against the ratio you are targeting: roughly 70–90% cloudy with minimal amber for a cerebral profile, more amber if you want a heavier, sedative one.
Tap Save and choose the environment
Saving starts with the space. Pick the tent, room or greenhouse this plant is growing in — the choice also decides which plants you see in the next step.
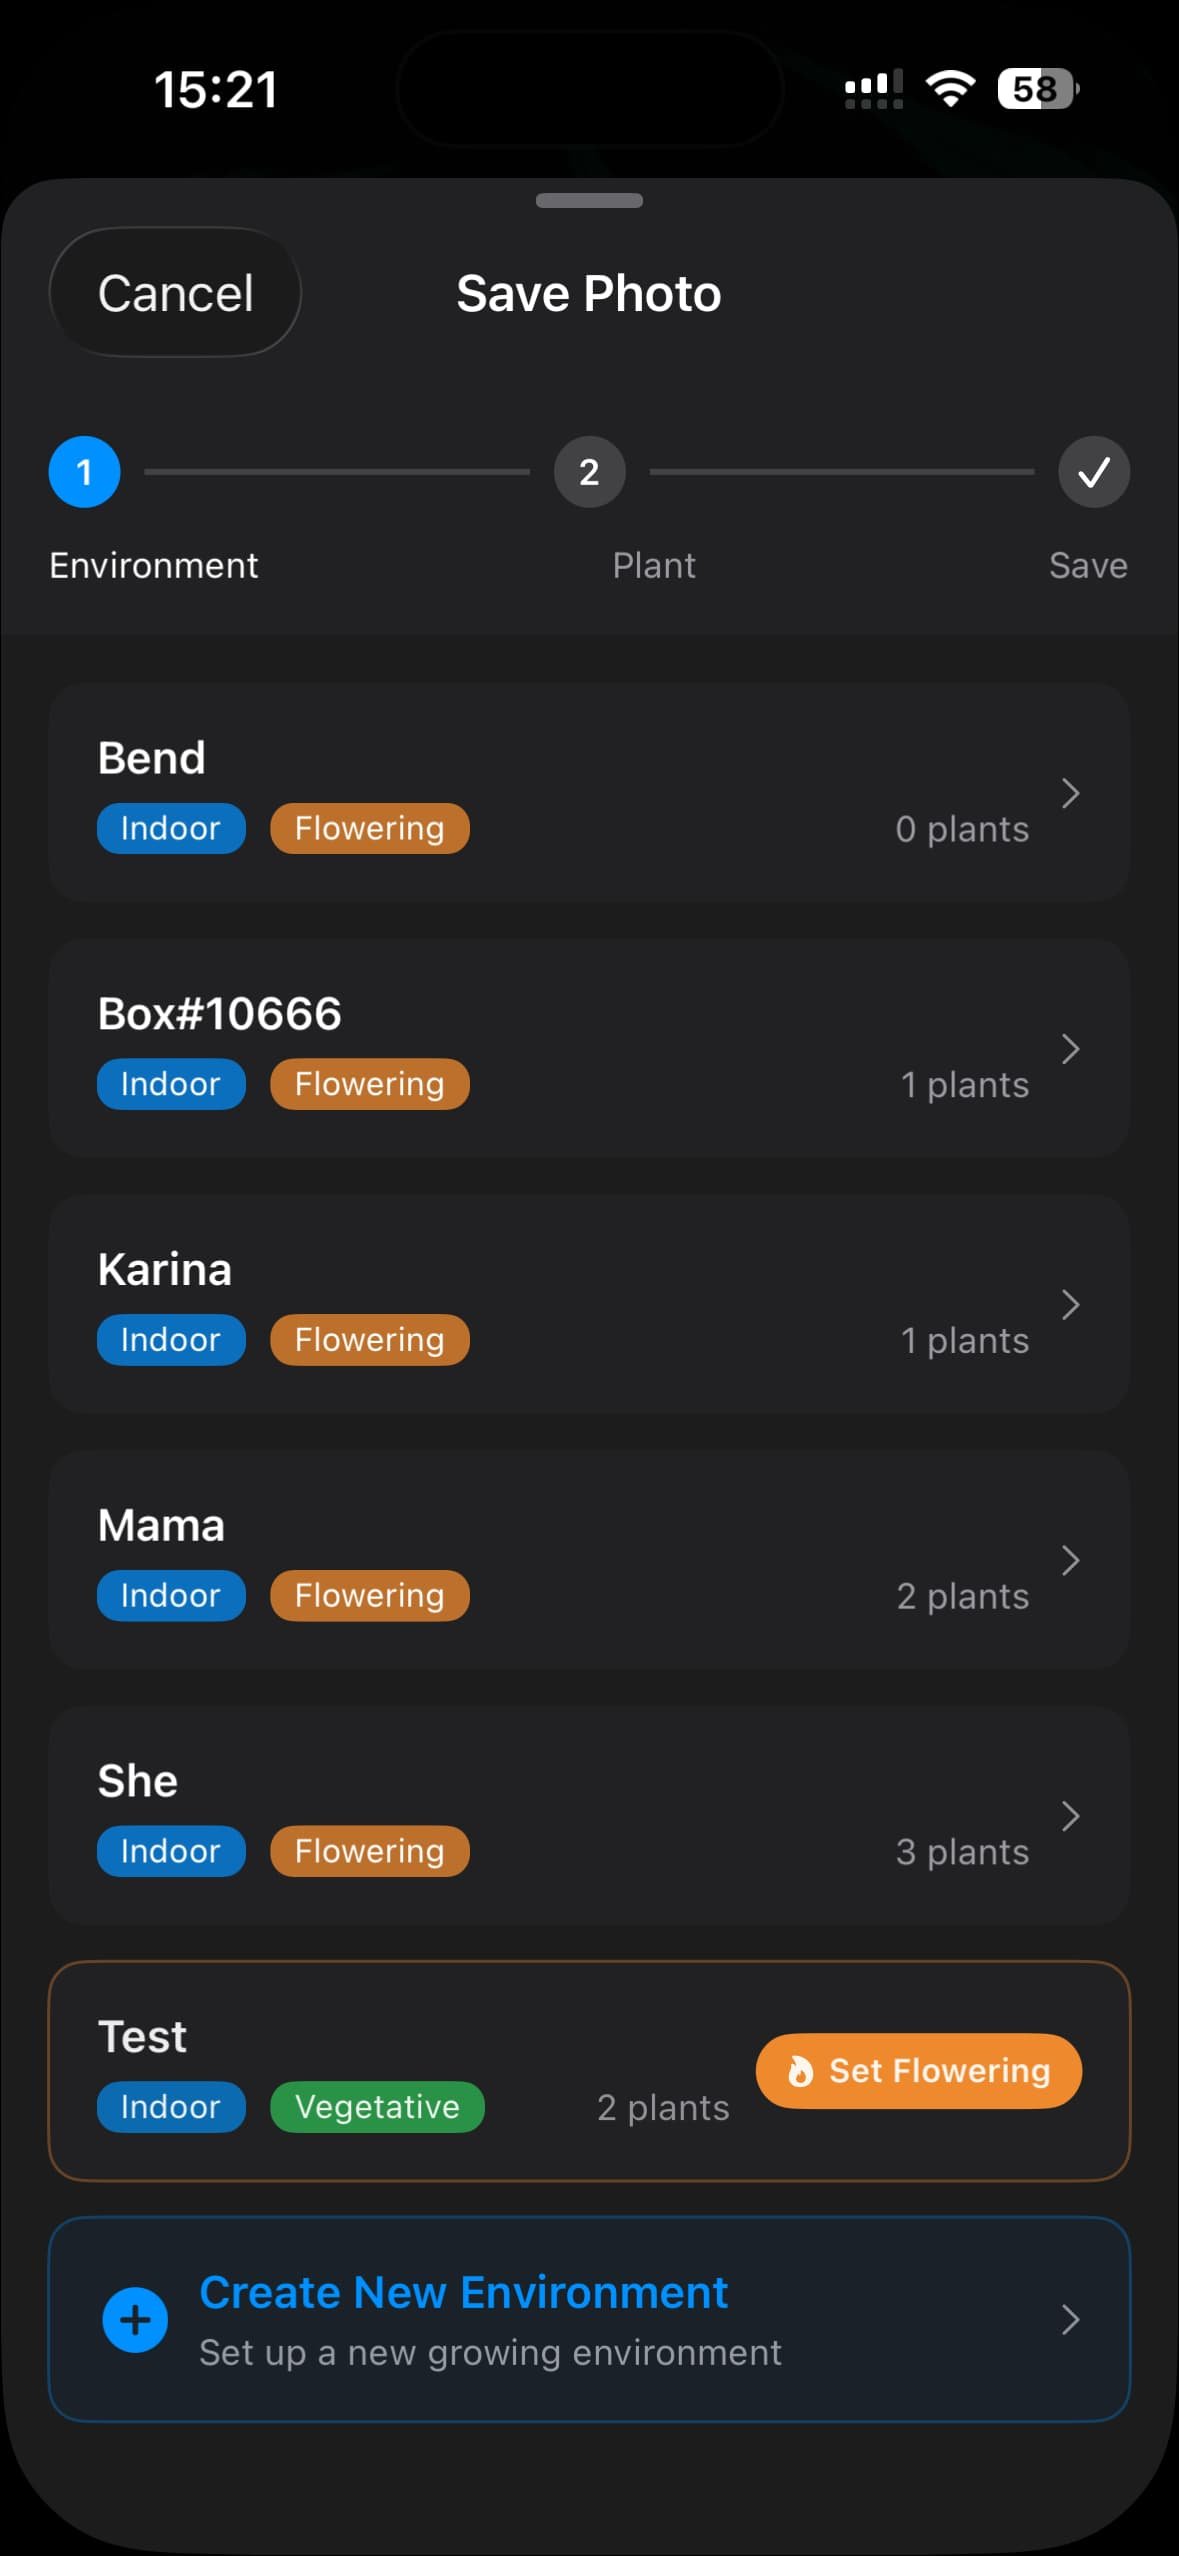
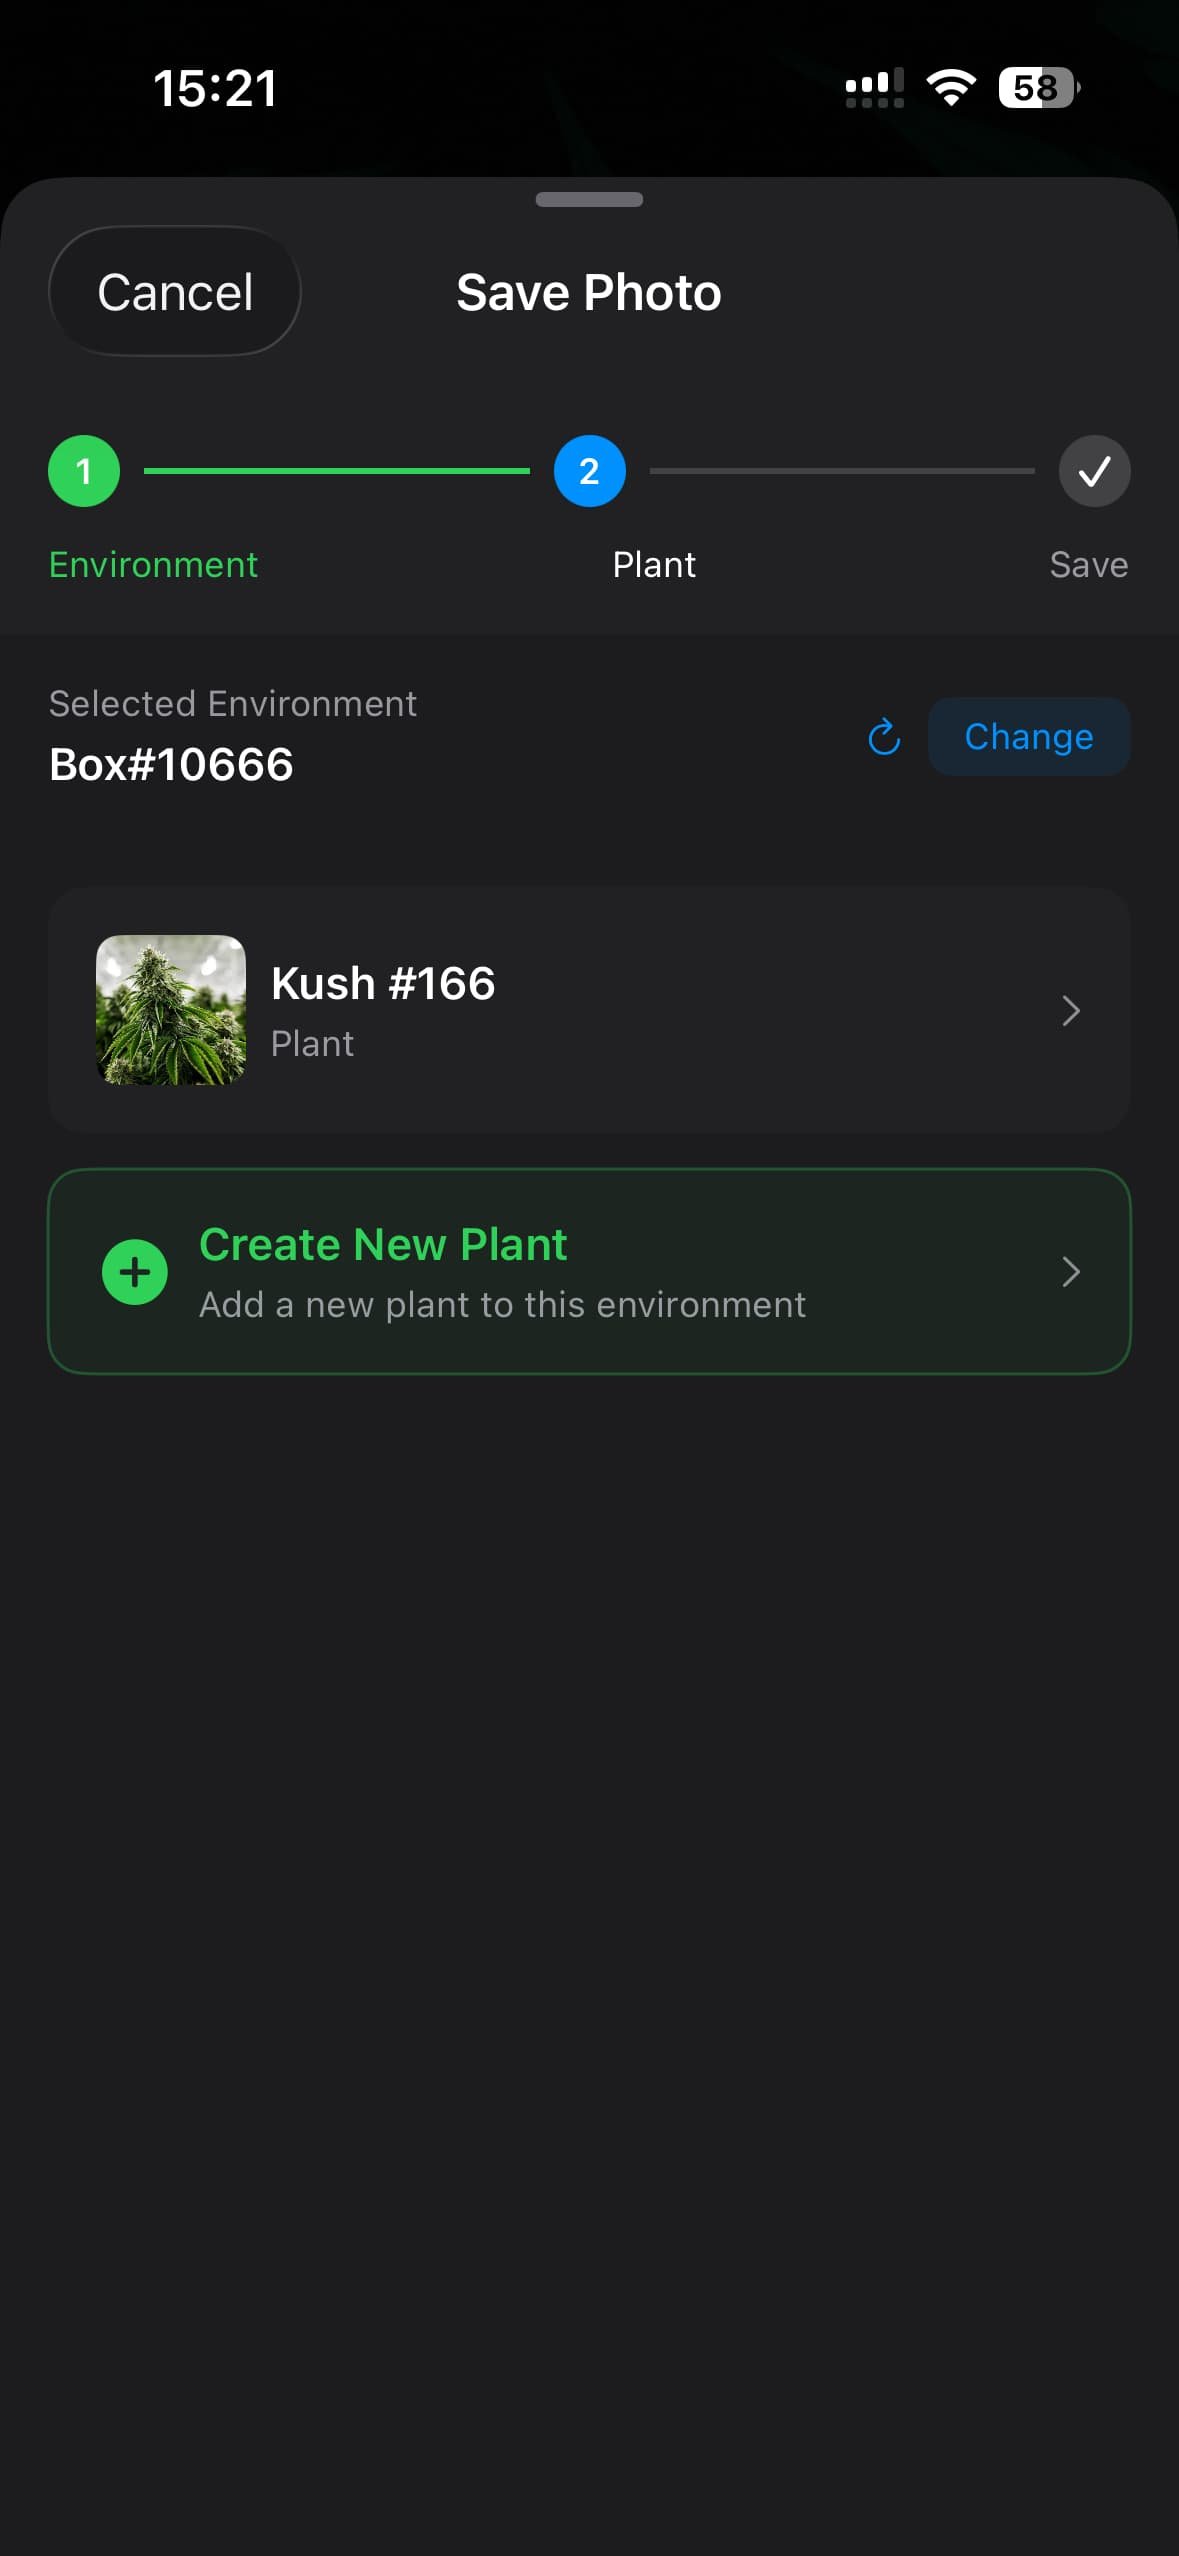
Choose the plant inside that environment
Now pick the plant you actually shot. This is the most important tap in the flow: it decides which timeline the reading feeds and which chart updates.
Running several plants of the same strain? Name them distinctly when you create them — “Gelato #2, left corner” beats four identical “Gelato” entries when you are picking one at a glance.
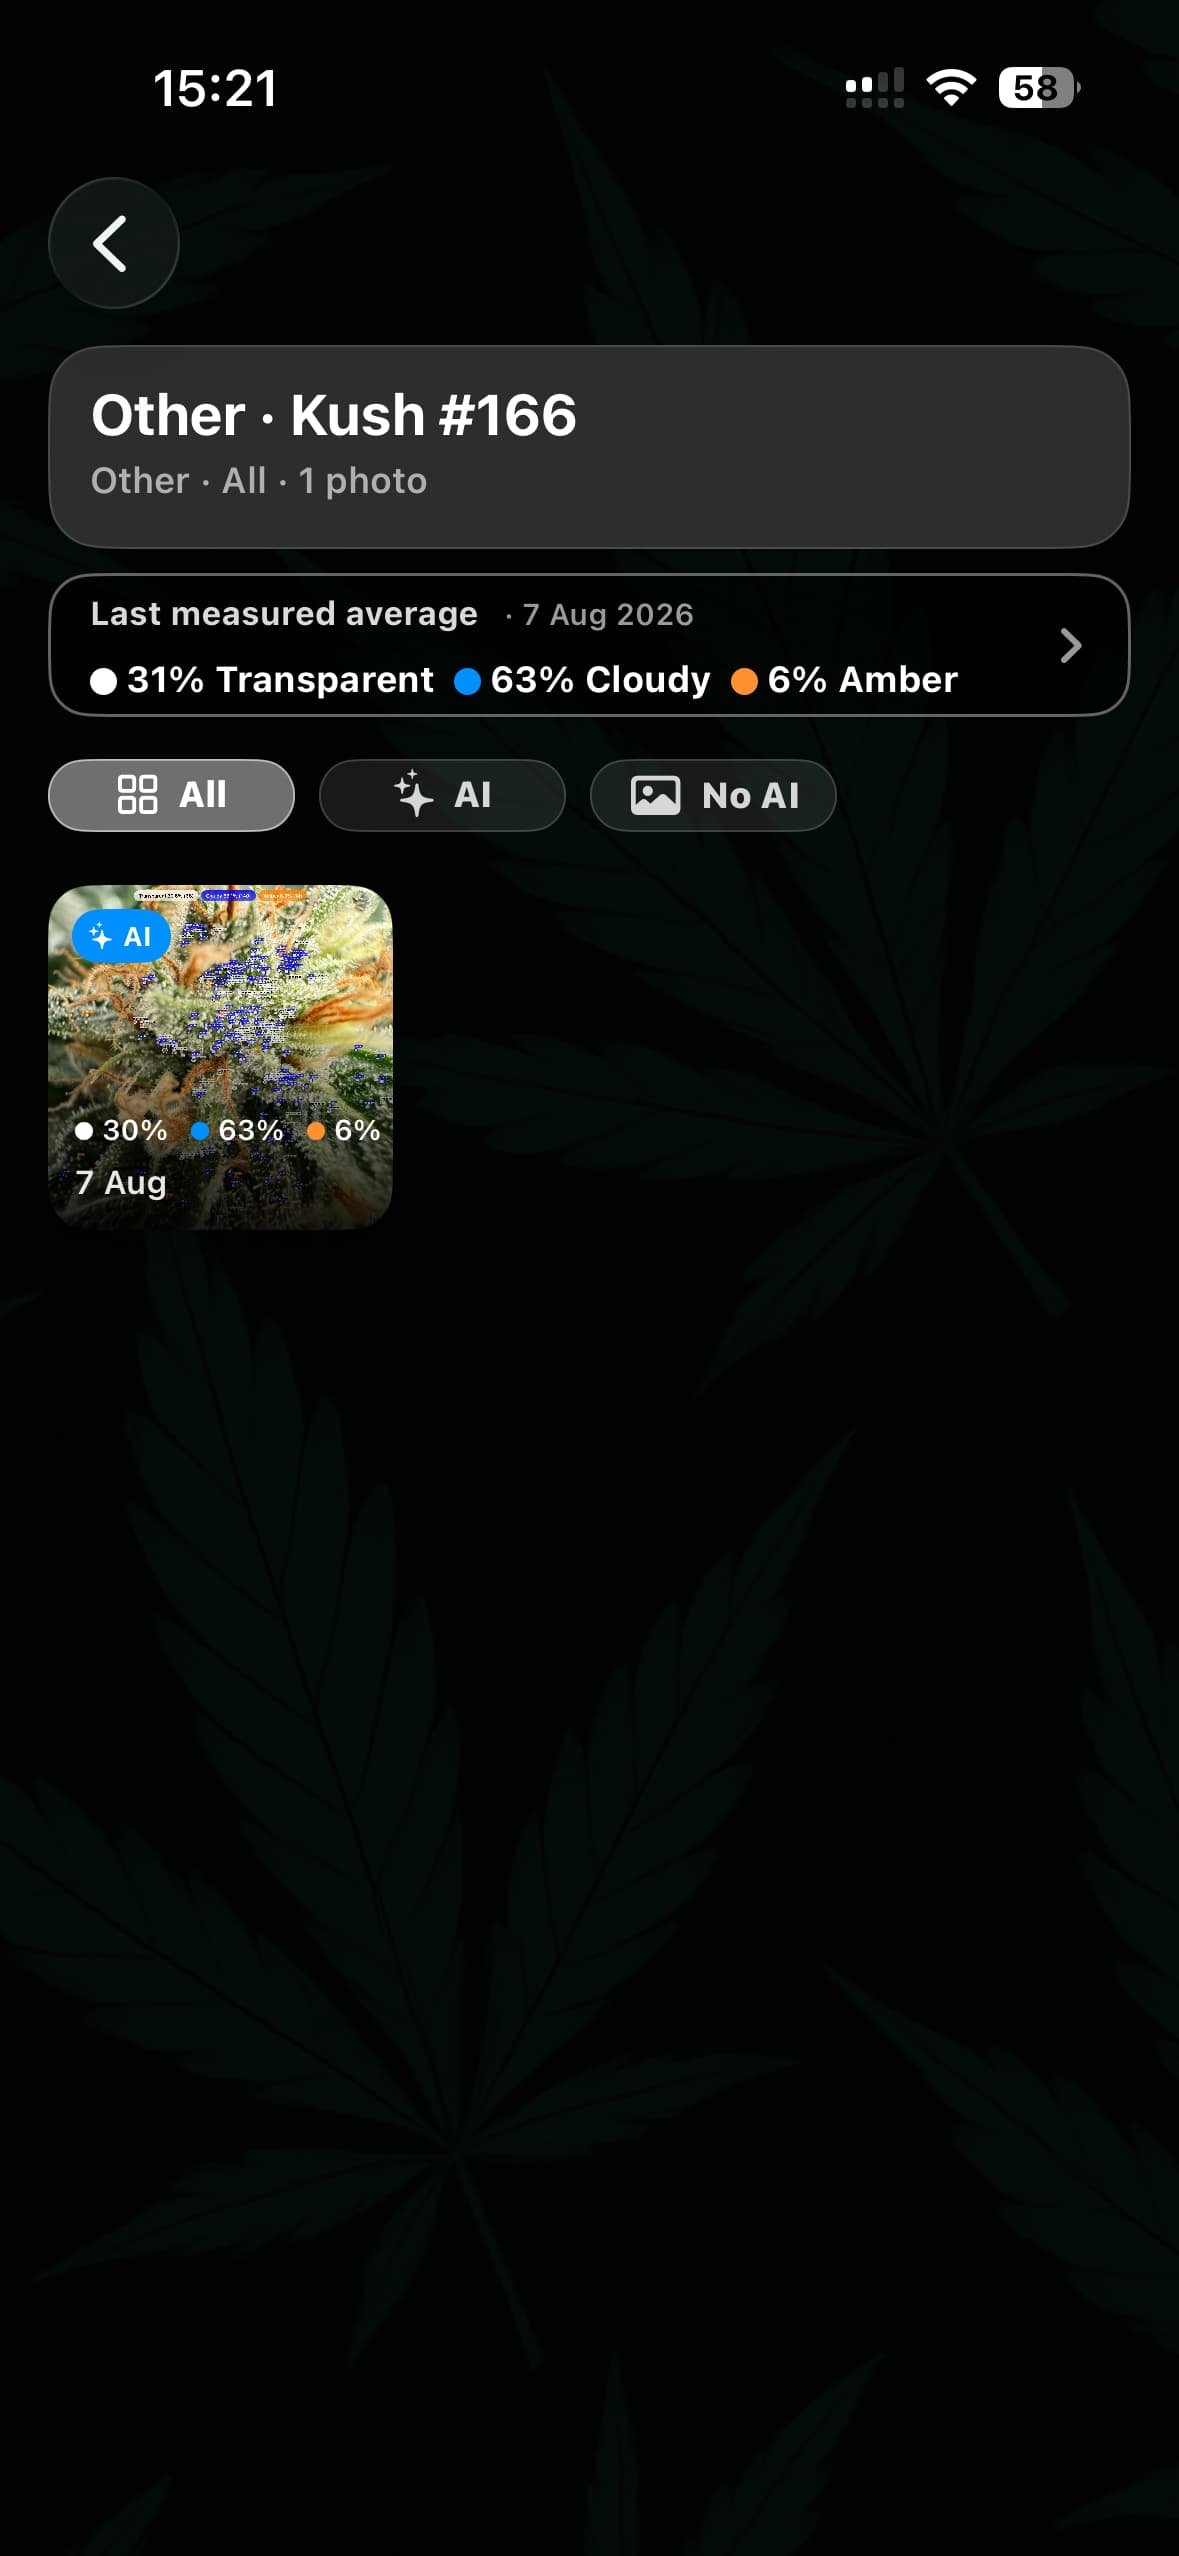
Confirm — and land on the plant, already updated
Save writes the photo and the full trichome breakdown to that plant inside that environment, timestamped, and takes you straight to the plant page. The image sits in its gallery, the percentages sit on its maturity timeline, and the chart redraws with the new point.
One upload gives you a snapshot. Two or three across a week give you a slope — how fast cloudy is rising, when amber first appears, and how much runway is left before the window closes.
Shooting a Photo the Model Can Read
The analysis is only as good as the frame you feed it. Four things account for most of the difference between a reliable reading and a noisy one:
Shoot the calyx, not the sugar leaves
Trichomes on sugar leaves mature faster and will skew your result toward amber. Frame the swollen calyx on the cola itself — that is the reference surface for harvest timing.
Fill the frame
Get close enough that trichome heads are clearly resolved, and let them occupy most of the image. More heads detected means a more stable percentage. Macro mode on iPhone 13 Pro and later, or a clip-on macro lens, does the job.
Use neutral white light
Purple LED spectrum shifts the colour of every head in the frame, and colour is exactly what the model reads. Shoot under white light or your phone torch, never under bloom-spectrum LEDs.
Repeat the same shot
Same cola, same distance, same light, roughly the same time of day. Consistency across uploads is what makes the curve meaningful rather than just jittery.
One shot per bud, several buds per plant
Maturity is not uniform across a plant. Upper colas run ahead of lower branches. If you are planning a staggered harvest, upload a separate photo per cola and save each one to the same plant, rather than treating a single frame as the whole plant.
Why Save Asks for an Environment and a Plant
It would be simpler to hand you a number and stop there. The reason the save flow asks two questions is that a number on its own answers the wrong one.
What you actually need to know at the end of flower is not “how mature is this trichome” but “how fast is this plant moving, and how many days do I have left”. That takes a series of readings tied to one plant, alongside the conditions that plant was living in. Once the data is filed correctly, the temperature spike that shortened your window or the UV-B schedule that thickened your resin stops being a hunch and becomes something you can look at across cycles.
What Each Saved Upload Feeds
One photo, three places it shows up.
📈
The Maturity Curve
Each analysis becomes a timestamped point on the plant’s trichome timeline, showing both the current state and the rate of change.
🌱
The Plant Record
The photo and its breakdown stay attached to the plant, next to your feeding, training and observation entries.
🌡️
The Environmental Context
Because the plant sits inside an environment, every maturity reading can be read against the temperature, humidity and VPD it was recorded under.
Runs entirely on-device · Apple Neural Engine · No cloud required
Frequently Asked Questions
Do I need a plant before I can upload?
Not to run the analysis — upload a photo and you get the breakdown immediately. You need one to save it, since the save flow asks for an environment and then a plant. Create both once at the start of the grow and every upload afterwards is two taps to file.
Why does the app ask for the environment before the plant?
Plants live inside environments, so the environment you choose filters the plant list you see next — no scrolling past plants from another tent. It also keeps the reading attached to the conditions it was taken under, which is what makes cross-cycle comparison possible later.
Do I need an internet connection to run the analysis?
No. Detection and classification run on-device on the Apple Neural Engine, and your data is stored locally on the iPhone. The app works in a basement grow room with no signal.
Can I use photos from a USB microscope or a digital loupe?
Yes. Anything that ends up in your photo library can be uploaded. Higher magnification usually improves head separation, as long as the image stays in focus and the white balance is neutral.
How often should I upload during late flower?
Every two or three days once you are in week six or later. The peak cloudy window commonly lasts 5–10 days, so a single weekly check can miss it entirely. More frequent uploads mean more points on the curve and a clearer read on the slope.
Can I save several photos to the same plant on the same day?
Yes, and for a large plant it is worth doing. Shoot the top cola and a mid-level branch separately and save both to the same plant — the difference between them is exactly the information you need for a staggered harvest.
What if I saved it to the wrong plant?
Open the analysis from that plant, delete it, then re-upload the photo and save it under the correct one. Keeping the timeline clean matters more than saving a re-upload — a misfiled reading distorts the curve for the rest of the cycle.
Continue Reading
Explore the full GrowBotiq scientific library on cannabis phytochemistry and cultivation science.
When to Harvest Cannabis
The Power of Trichomes
Cannabinoid Biosynthesis
Light & Metabolite Profiles