

Lights · Environment
PPFD and DLI for Cannabis: How Much Light Each Stage Needs
Light intensity, daily light integral and what the research says about pushing more photons into the canopy.
4 min read
Watts tell you what a lamp costs to run. They do not tell you how much light reaches the plant. For that, growers use two numbers: PPFD, the intensity at a moment, and DLI, the total dose over a day. Get them right and the rest of the room has something to work with. Get them wrong and no nutrient or climate tweak will make up for it.
PPFD: light at the canopy
Photosynthetic photon flux density counts the photons between 400 and 700 nm landing on a square metre every second, in µmol/m²/s. It is measured with a quantum sensor at the top of the canopy, in several spots, because the centre of a tent under one lamp can read twice what the corners do.
DLI: the daily dose
The daily light integral adds up PPFD over the photoperiod:
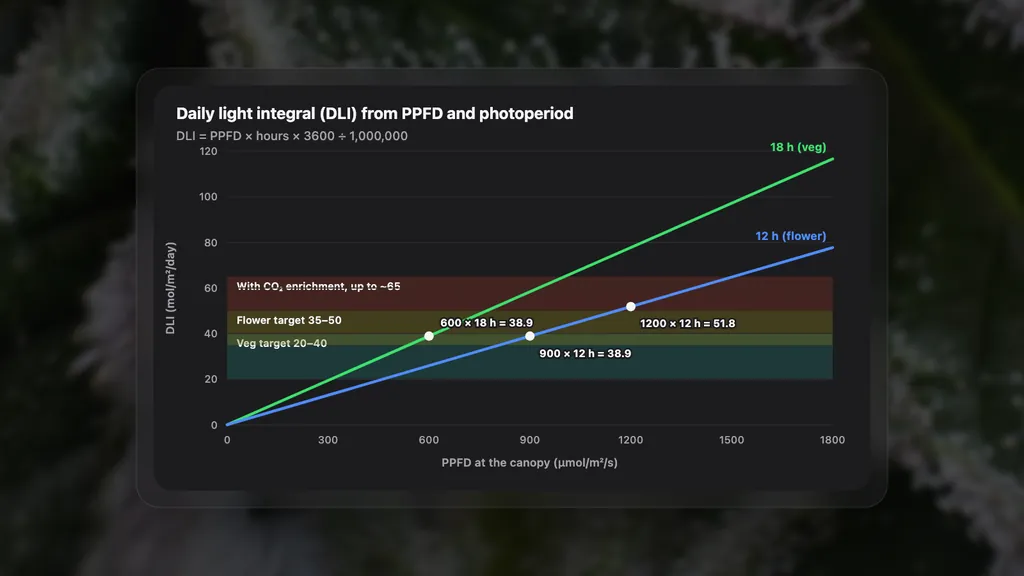
DLI (mol/m²/day) = PPFD × hours of light × 3,600 ÷ 1,000,000
This is why the photoperiod matters as much as the lamp. 600 µmol/m²/s for 18 hours in veg delivers the same 38.9 mol/m²/day as 900 µmol/m²/s for 12 hours in flower.
Targets by stage
| Stage | Photoperiod | PPFD | DLI |
|---|---|---|---|
| Clones and seedlings | 18 h | 150–300 | 10–20 |
| Vegetative | 18 h | 300–600 | 20–40 |
| Flower | 12 h | 800–1,000 | 35–45 |
| Flower with CO₂ enrichment | 12 h | 1,000–1,500 | 45–65 |
These are typical working ranges. The ceiling depends on everything else in the room: CO₂, temperature, root zone and genetics all set how much light a plant can actually use.
What the research says about more light
For a long time growers assumed cannabis saturates at moderate intensities. Leaf-level measurements already suggested a high ceiling: net photosynthesis kept rising up to around 1,500 µmol/m²/s at optimal temperature in one early study (Chandra et al., 2008).
A whole-plant trial in an indoor environment went further. Rodriguez-Morrison and colleagues grew plants under canopy PPFDs from about 120 to 1,800 µmol/m²/s on a 12-hour photoperiod at ambient CO₂. Inflorescence yield increased linearly across the whole range, while the concentration of THC and CBD in the flowers did not change in a meaningful way (Rodriguez-Morrison et al., 2021).
Two conclusions follow. More light means more flower, so light is usually the lever with the biggest effect on yield. But it does not make each gram stronger, so the quality of the flower still comes down to genetics, climate and harvest timing. And since electricity is the largest running cost of most indoor grows, the right intensity is an economic decision as well as a biological one (Eaves et al., 2020). Our article on grams per watt shows how to measure that trade-off.
How to apply it
- Map the canopy. Take PPFD readings in a grid, at least nine points per lamp footprint. Raise or dim the lamp until the edges are inside the target range.
- Ramp up. Move plants to a higher intensity over several days after transplant or flip. Bleaching tops are the sign of too much, too fast.
- Raise CO₂ only with light. Extra CO₂ pays off above roughly 1,000 µmol/m²/s. Below that, it is mostly wasted.
- Write it down. Lamp height, dimmer setting and photoperiod per room per cycle. It is the only way to compare cycles fairly.
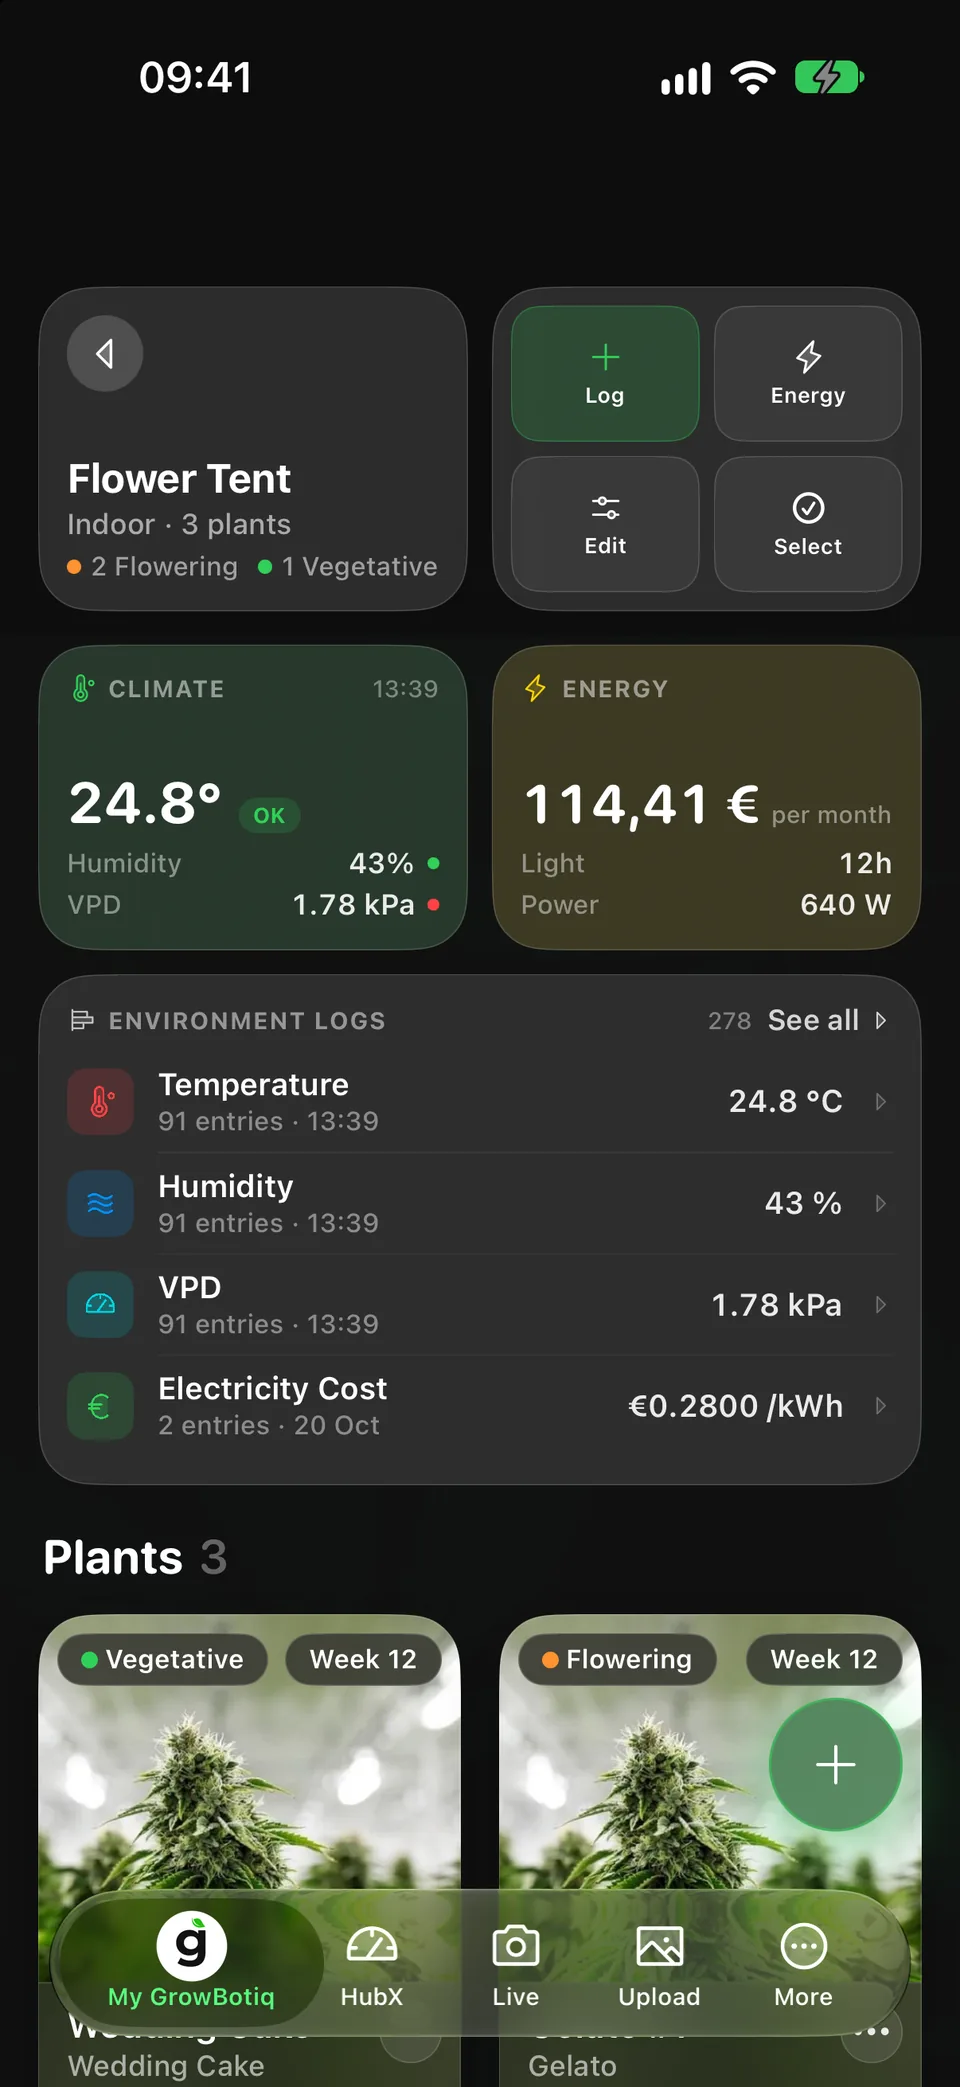
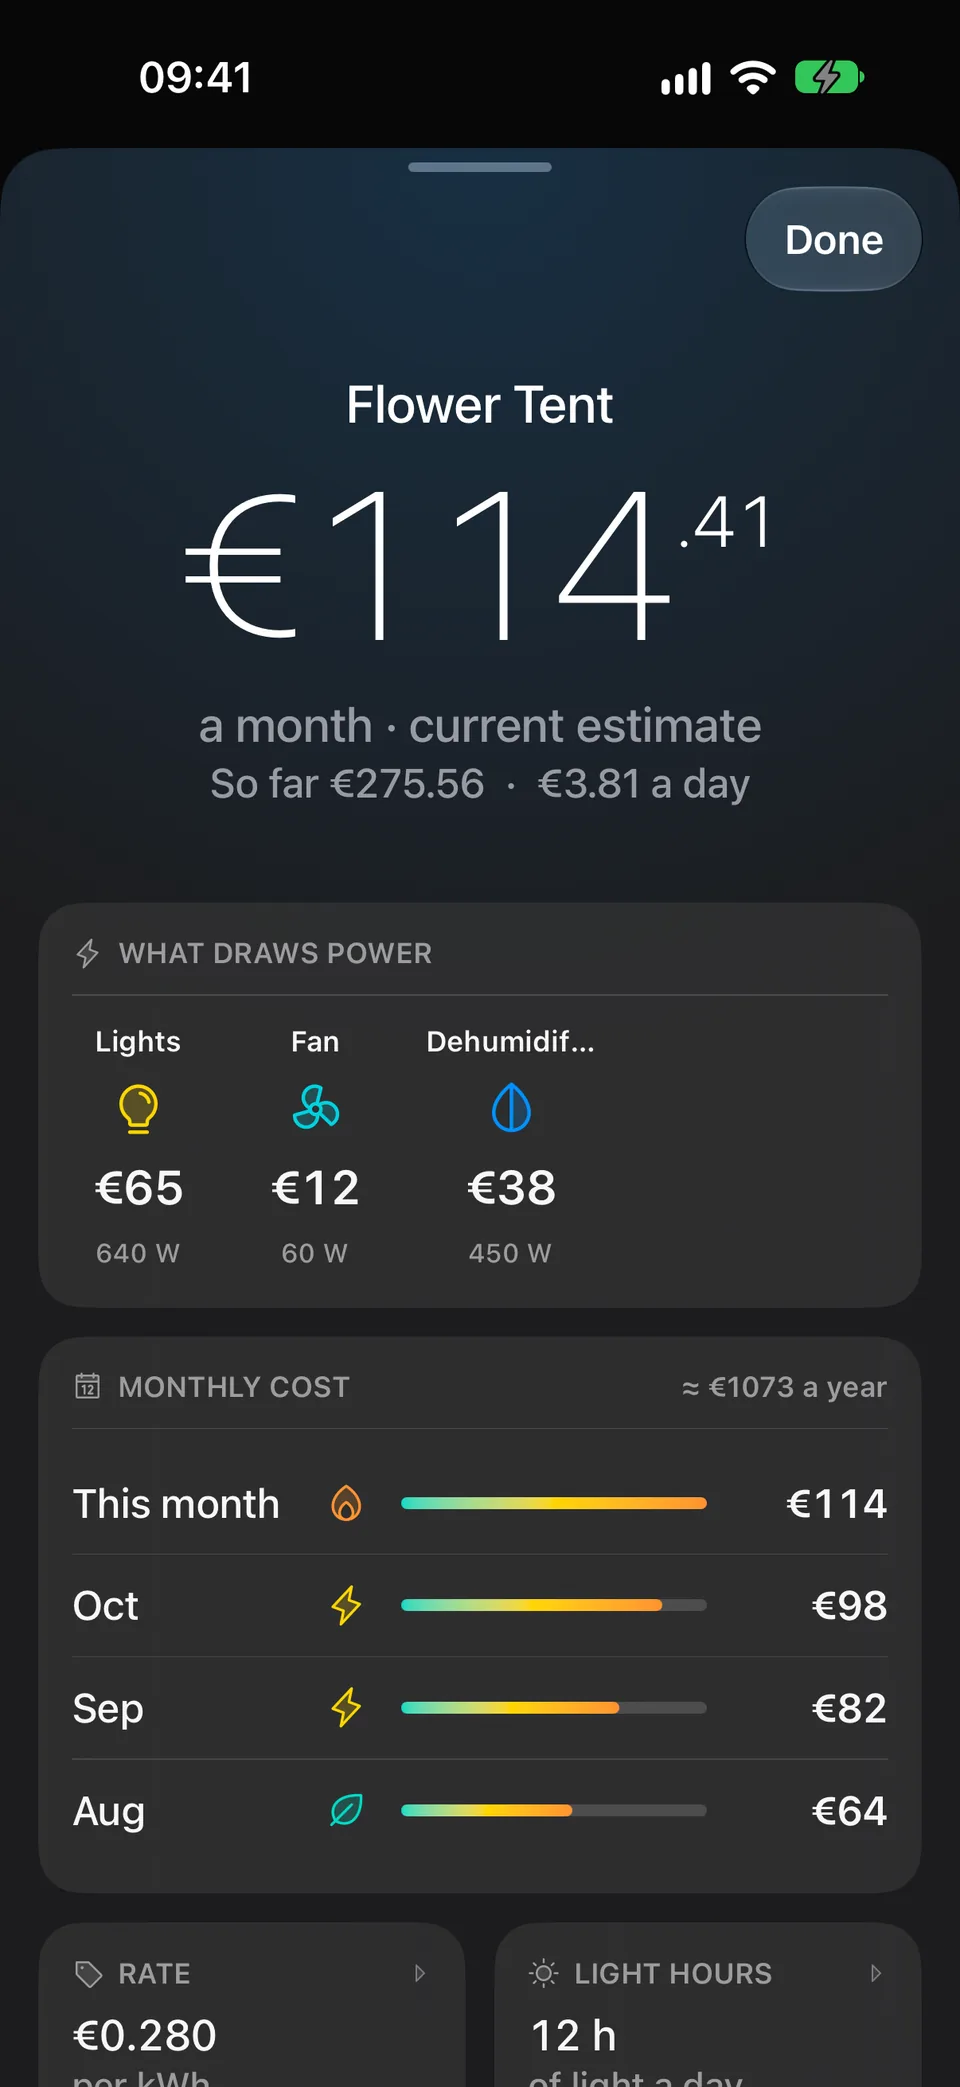
Running flower rooms at commercial scale? In GrowBotiq Lab Business every room logs PPFD next to temperature, humidity, VPD, CO₂, pH and EC, with the target for its stage, so the whole team sees when a room drifts.

References
- Rodriguez-Morrison V, Llewellyn D, Zheng Y (2021). Cannabis yield, potency, and leaf photosynthesis respond differently to increasing light levels in an indoor environment. Frontiers in Plant Science 12:646020.
- Chandra S, Lata H, Khan IA, ElSohly MA (2008). Photosynthetic response of Cannabis sativa L. to variations in photosynthetic photon flux densities, temperature and CO₂ conditions. Physiology and Molecular Biology of Plants 14(4):299–306.
- Eaves J, Eaves S, Morphy C, Murray C (2020). The relationship between light intensity, cannabis yields, and profitability. Agronomy Journal 112(2):1466–1470.