

Environment · Climate
VPD Chart for Cannabis: Seedling, Veg and Flower
The vapour pressure deficit targets for every stage, the formula behind the numbers, and why the leaf, not the air, decides.
5 min read

Temperature and humidity are the two numbers every grower watches, but the plant does not respond to either on its own. It responds to how hard the air is pulling water out of the leaf. That pull is the vapour pressure deficit, or VPD, and it is the single most useful number for setting up a grow room climate.
What VPD is
Air at a given temperature can hold only so much water vapour. The pressure that vapour exerts when the air is saturated is the saturation vapour pressure, and it rises steeply with temperature. VPD is the gap between that maximum and the vapour actually in the air. A large gap means dry air that pulls water from the leaves quickly; a small gap means humid air where transpiration slows down.
Plants respond to VPD through their stomata, the pores they use to take in CO₂ and lose water. When VPD rises too far, stomata close to save water, and photosynthesis falls with them. When it is too low, transpiration slows, nutrient uptake carried by the water stream slows too, and wet leaf surfaces invite fungal disease (Grossiord et al., 2020).
The formula
Saturation vapour pressure in kilopascals at temperature T in °C:
SVP = 0.61078 × e(17.27 × T ÷ (T + 237.3))
Then:
VPD = SVP(leaf temperature) − SVP(air temperature) × RH ÷ 100
When the leaf is at air temperature, this simplifies to SVP × (1 − RH/100). At 26 °C and 60% relative humidity, SVP is 3.36 kPa and the VPD is 1.34 kPa.
The chart
Every value below is calculated with that formula, with the leaf at air temperature. Find your room temperature on the left and your humidity across the top.
The colour bands are the ranges most growers aim for. They are working targets drawn from horticultural practice, not hard limits from one study:
| Stage | Target VPD | Typical room |
|---|---|---|
| Clones and seedlings | 0.4–0.8 kPa | 22–26 °C, 70–80% RH |
| Vegetative | 0.8–1.2 kPa | 22–28 °C, 60–70% RH |
| Early and mid flower | 1.0–1.5 kPa | 20–26 °C, 50–60% RH |
| Late flower | 1.2–1.6 kPa | 18–24 °C, 40–50% RH |
Late flower runs drier on purpose. Dense buds trap moisture, and grey mould (Botrytis cinerea) thrives in still, humid air around them. Keeping VPD up in the last weeks is one of the cheapest forms of disease prevention there is (Punja, 2021).
Leaf temperature changes everything
The chart assumes the leaf is at air temperature. Often it is not. A leaf under strong light can run warmer than the air; a well-ventilated leaf transpiring hard runs cooler. Because SVP is so sensitive to temperature, a leaf two degrees cooler than the air sees a markedly lower VPD in the same room:
An inexpensive infrared thermometer pointed at the top of the canopy tells you where your leaves really are. If they read cooler than the air, aim for a slightly higher air VPD on the chart to land the leaf in range.
How to dial in your room
- Measure at canopy height, not on the wall. Climate at the top of the plants can differ by several degrees and ten points of humidity from the room average.
- Fix temperature first, then adjust humidity to hit the VPD. Temperature also drives growth rate and terpene loss, so it should not be sacrificed for the VPD number.
- Watch lights-off. When the lamps switch off, temperature drops and relative humidity jumps. Most mould problems start in the dark period, so give the dehumidifier a head start before lights-off.
- Change targets gradually as the plants move from veg to flower, over a few days, not overnight.
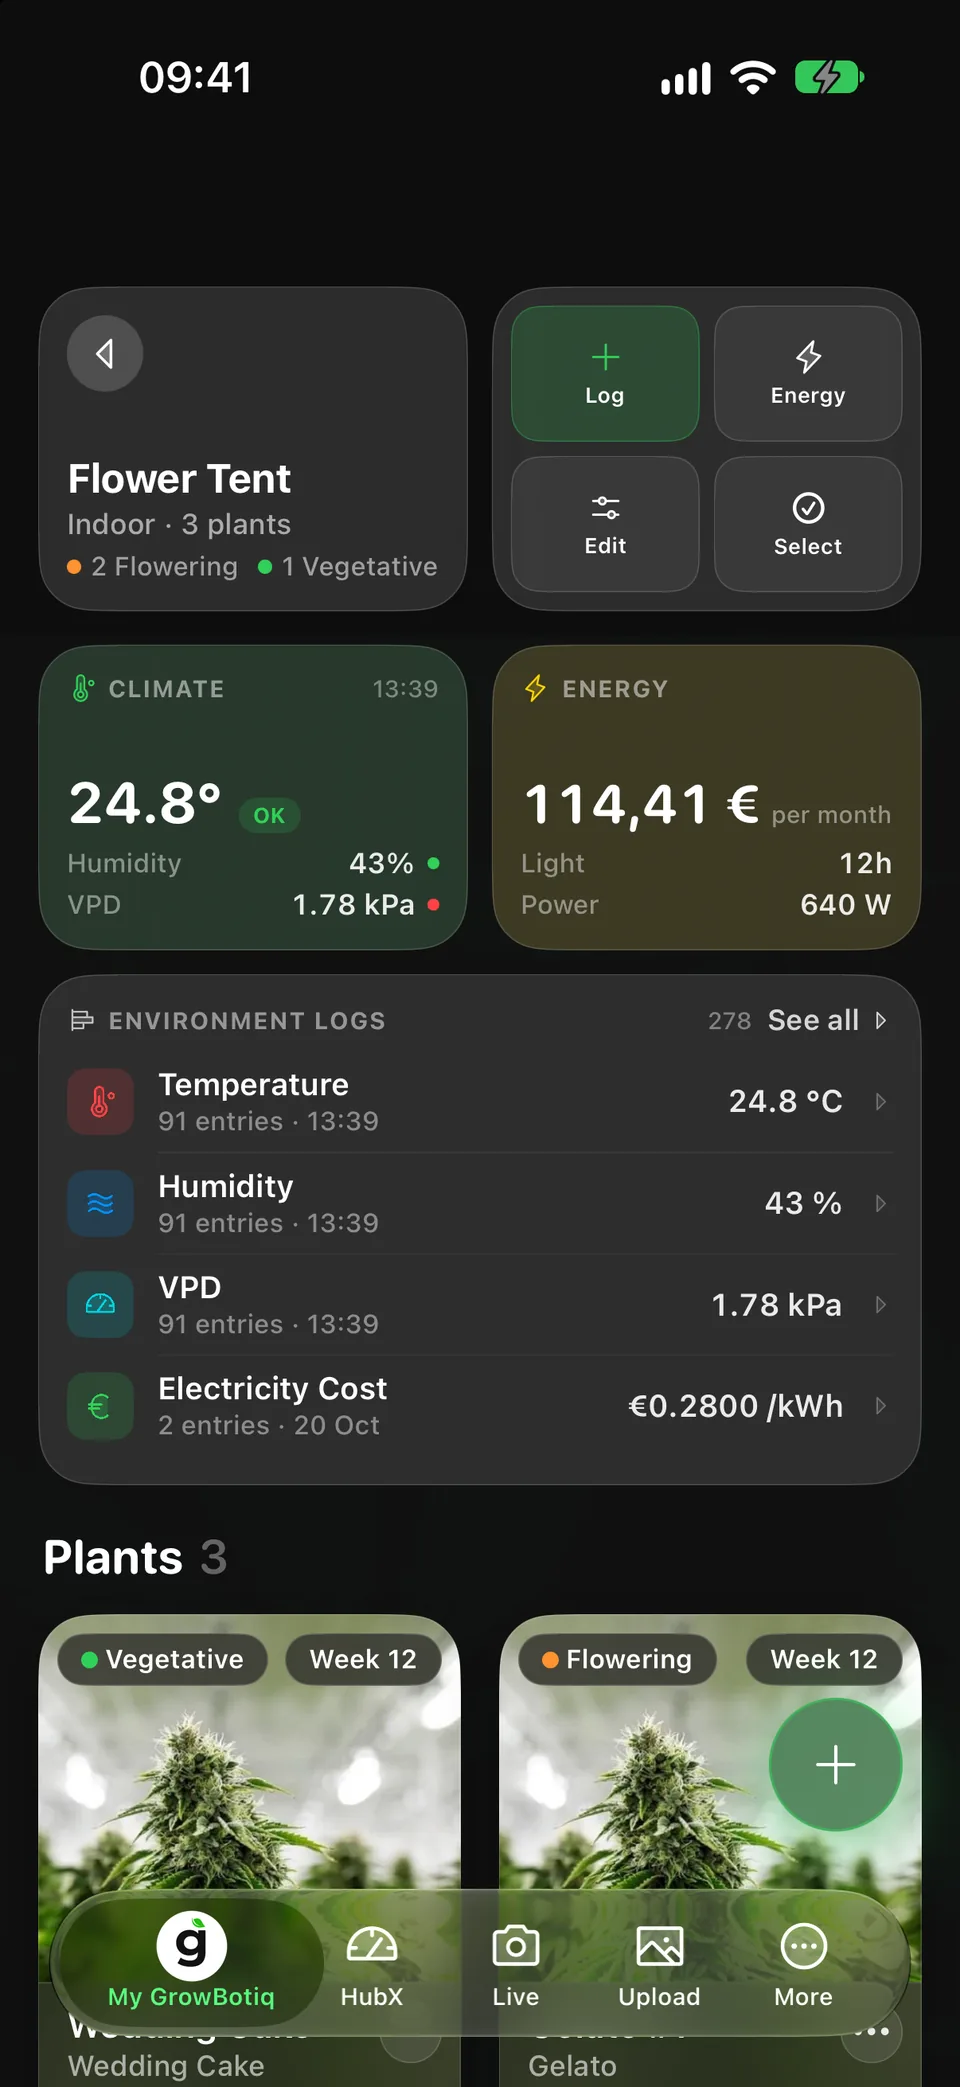

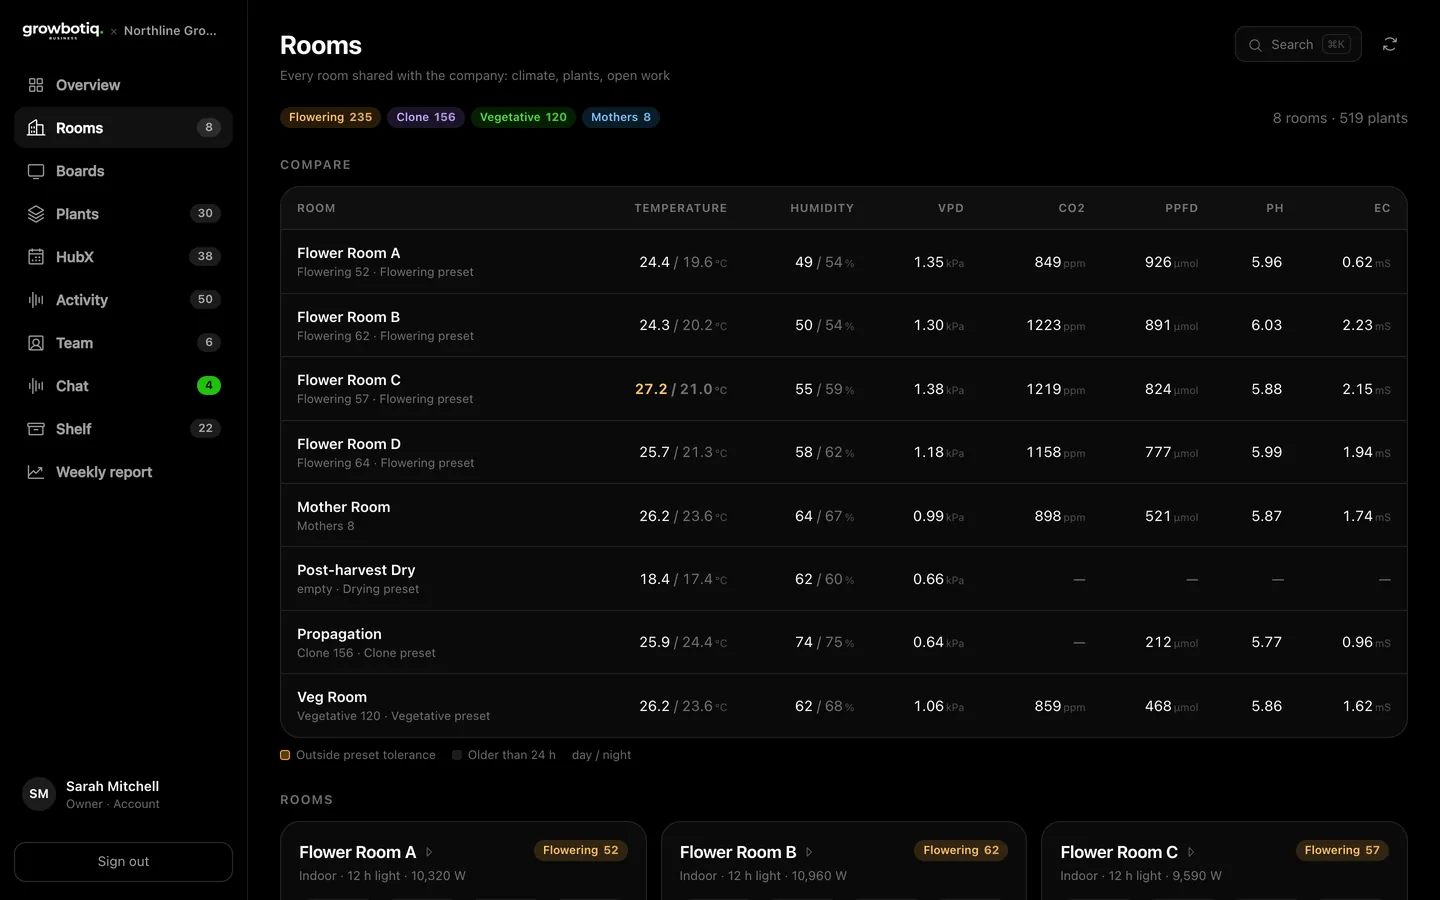
Running several rooms with a team? GrowBotiq Lab Business shares every room’s climate with the whole crew in real time, on the phone and on a web dashboard.
References
- Grossiord C, Buckley TN, Cernusak LA, et al. (2020). Plant responses to rising vapor pressure deficit. New Phytologist 226(6):1550–1566.
- Punja ZK (2021). Emerging diseases of Cannabis sativa and sustainable management. Pest Management Science 77(9):3857–3870.
- Chandra S, Lata H, Khan IA, ElSohly MA (2008). Photosynthetic response of Cannabis sativa L. to variations in photosynthetic photon flux densities, temperature and CO₂ conditions. Physiology and Molecular Biology of Plants 14(4):299–306.