

Post-Harvest · Quality
Water Activity in Cannabis: aw Targets, Moisture and Mould
Water activity, not the moisture percentage, decides whether dried flower grows mould, passes the lab and keeps its weight. Here is the target, the science behind it and how to hit it.
10 min read
Two jars of flower can show the same moisture percentage on a lab report and behave completely differently: one stays clean for a year, the other grows mould in a month. The number that separates them is water activity. It is what microbes respond to, what regulated markets test, and what decides how much weight a batch still has on the day it is sold.
This guide covers what water activity is, why the target for dried cannabis is 0.55 to 0.65, how it relates to moisture content, and how a facility measures and steers it from the dry room to the bag.
What water activity measures
Water in plant tissue is not all the same. Part of it is held tightly by sugars, proteins and cell walls; the rest is free to evaporate, to move, and to be used by bacteria and fungi. Water activity, written aw, measures how free the water is: the vapour pressure of the water in the sample divided by the vapour pressure of pure water at the same temperature. Pure water is 1.00, a completely dry material is 0.
There is a practical way to read it. Seal a sample in a small chamber and wait: the air above it settles at a relative humidity that depends only on the sample. That equilibrium relative humidity, divided by 100, is the water activity (Das et al., 2022). Flower at 0.62 aw holds the air around it at 62% RH. This is why a hygrometer in a sealed jar works as a rough water activity meter, and why a dry room held at 60% RH pulls flower towards 0.60.
Moisture content answers a different question: how much water there is, as a share of the weight. Water activity says what that water can do. Food science has known since the 1950s that microbial growth follows water activity, not the amount of water (Scott, 1957).
What grows at which water activity
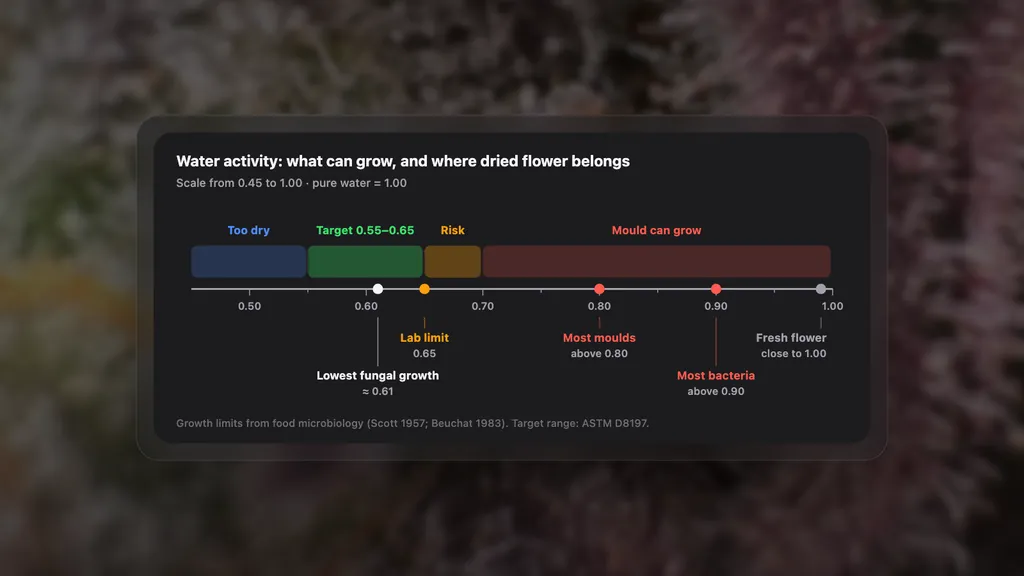
Every microbe has a minimum water activity below which it cannot grow. Most bacteria need more than 0.90. Most moulds stop at about 0.80. A few dry-loving (xerophilic) species keep growing slowly below 0.70, and the lowest water activity at which any fungal growth has been observed is about 0.61 (Scott, 1957; Beuchat, 1983). Growth is fastest near 0.90, and the production of mycotoxins generally needs 0.83 or more.
Fresh flower sits at the far end of that scale: it is 75 to 80% water at harvest (Das et al., 2022), with a water activity close to 1. Drying is a race to bring every bud below the mould limits before the fungi already on the plant can use that water. And they are there. Swabs of buds in commercial drying rooms have shown Penicillium, Aspergillus and Cladosporium, and Botrytis infections that start in the grow carry on as losses after harvest (Punja et al., 2019).
In a study that sampled a commercial drying room day by day, total yeast and mould counts fell as the flower dried, and drying to 12 to 14% moisture, a water activity of about 0.65 to 0.70, or lower was one of the factors linked to lower counts (Punja et al., 2023). The same study adds a caution: drying stops growth, it does not sterilise. Spores survive, and any mycotoxin produced before the flower was dry stays in it. Low water activity protects a clean batch; it does not rescue a contaminated one, which is why prevention starts in the grow room with integrated pest management.
The target: 0.55 to 0.65
ASTM International publishes two standards on the subject. D8196 describes how to measure water activity in cannabis flower. D8197 sets the acceptable range for dry flower at 0.55 to 0.65: the upper limit keeps mould from growing, the lower one keeps the flower from breaking up in handling. Above 0.68 the standard requires further drying.
Regulators use the same number as a hard limit. In California, a batch of dried flower or pre-rolls passes only if its water activity does not exceed 0.65; above that it cannot be released for sale. Moisture content is reported on the certificate of analysis, but water activity is what passes or fails, and many other regulated markets draw the same line.
| Water activity | What it means | What to do |
|---|---|---|
| Above 0.70 | Moulds can grow; the flower is not shelf-stable | Keep drying, do not seal anything |
| 0.65–0.70 | Slow growth of dry-loving moulds is possible; fails a 0.65 limit | Dry further (required by ASTM above 0.68) |
| 0.55–0.65 | Target: stable against microbes and still pliable | Pack, then store cool and dark |
| Below 0.55 | Safe from microbes, but brittle: the flower breaks up and weight is lost | Stop drying; bring it back slowly if needed |
Water activity is not moisture content
The two numbers are linked by a curve called the moisture sorption isotherm: at a given temperature, each water activity corresponds to one moisture content. The curve is different for every material, and for cannabis it shifts with cultivar, resin content and temperature. Published figures show how wide the spread is. Flower dried to 12 to 14% moisture measured about 0.65 to 0.70 aw in one study (Punja et al., 2023); in another, flower cured for a month at 21 °C and 60% humidity averaged 8.6% moisture (Milay et al., 2020). A moisture percentage alone cannot tell you whether a batch is safe.
The curve also has a memory. Plant material that is drying down holds more water at a given water activity than the same material taking water back up, an effect called hysteresis. It is the reason sorption isotherms for hemp flower have been measured separately for drying and for wetting, at temperatures from 20 to 60 °C (Oduola et al., 2022).
Two practical consequences follow. Over-dried flower brought back with humidity packs reaches the target water activity at a lower moisture content than flower dried down to it once, so it weighs less. And the outside of a bud dries before its core: a bud can feel dry and snap at the stem while the centre is still above 0.70. Only a reading taken after the bud has equalised tells the truth.
Over-drying has a price
Every point of moisture below the target is weight that was grown, paid for and not sold. The arithmetic is simple: the dry matter of a batch is fixed, so its final weight is the dry matter divided by one minus the moisture content.
Starting from 1 kg of fresh flower at 78% moisture, finishing at 12% leaves 250 g; finishing at 8% leaves 239 g. Those four points cost 4.3% of the saleable weight, about 4.3 kg on every 100 kg of dried flower, and brittle flower sheds trichome heads every time it is handled. In a facility that sells by weight, the last two days in the dry room are worth more than many changes made in flower. It is the same logic as in our cost per gram breakdown: the cheapest gram is the one you do not lose.
How to measure it properly
A water activity meter seals a few grams of flower in a small chamber and reads the humidity of the air above it once it settles, with a chilled-mirror dew point sensor or a capacitive humidity sensor. The instrument matters less than the routine.
- Sample the batch, not a bud. Take flower from several plants and positions, large buds included: the wettest bud sets the risk.
- Let it equalise. Measure after the flower has rested in a closed container, not straight off the drying line, so the core and the surface agree.
- Match the temperature. Sample and meter must be at the same temperature. Saturation vapour pressure rises about 6% per degree, so flower 1 °C warmer than the sensor reads about 0.04 too high at 0.60.
- Fill the cup the same way. Same amount, same fill level, lid closed at once.
- Verify the meter. Check it against salt standards on a schedule and log the check.
- Record it per batch. Date, lot, room, reading and temperature, next to the dry weight.
Steering the dry room to the target
Flower equalises with the air around it, so the room’s relative humidity is the destination and time is the path. A dark room at 15 to 21 °C and about 60% RH takes flower towards 0.60, as in our guide on how to dry and cure cannabis. The skill is getting there slowly enough to dry the core and fast enough to beat the mould.
- Size dehumidification for the first days. Flower loses about three quarters of its fresh weight as water vapour, most of it early. The room has to remove that load, not just hold an empty room at 60%.
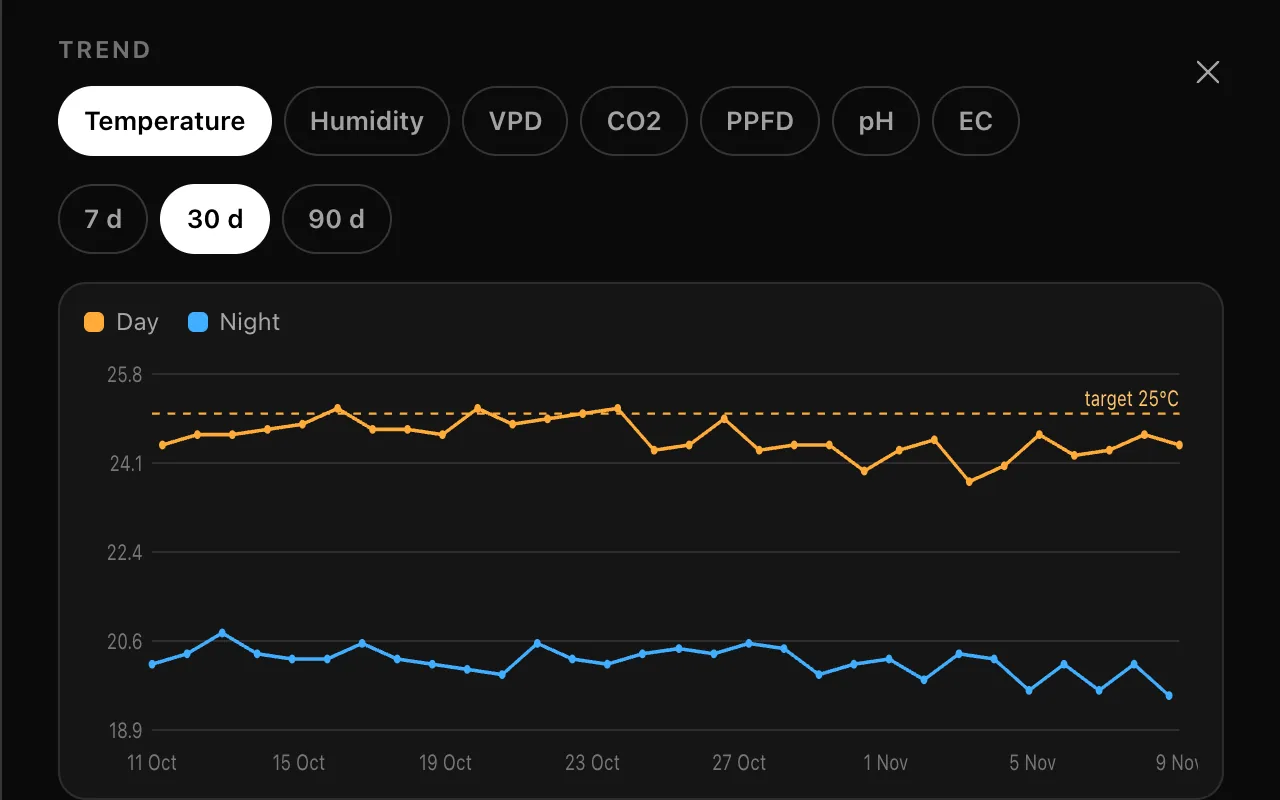
- Hold humidity steady. Relative humidity moves with temperature, so a stable temperature is half of a stable RH. Swings dry the outside of the bud and wet it again. Our VPD chart explains how the two are tied.
- Finish on the meter, not the calendar. Start measuring when small stems snap. Move on only when the batch reads below 0.65 after equalising.
- Aim for the middle. Packing near 0.60 leaves margin on both sides: an uneven batch or a warm truck does not push a sample over the limit.
- Store cool, dark and stable. Temperature swings move water inside a sealed bag. In a one-year comparison, whole flower kept at 4 °C held its cannabinoids and terpenes better than flower at room temperature or ground flower (Milay et al., 2020).
A post-harvest checklist
- Harvest clean: remove every bud with visible rot before it enters the dry room.
- Record the wet weight of each batch on the day.
- Dry in the dark at 15 to 21 °C and 55 to 65% RH with gentle air movement, and log temperature and humidity daily.
- When small stems snap, rest a sample in a closed container and measure its water activity.
- Above 0.65, keep drying. Above 0.70, do not seal anything.
- Pack between 0.55 and 0.65, aiming near 0.60, and record the reading with the lot.
- Record the dry weight next to the wet weight, so the next run has a number to compare.
- Store cool, dark and sealed, and check water activity again before release.
References
- ASTM International. ASTM D8196-22, Standard Practice for Determination of Water Activity (aw) in Cannabis Flower.
- ASTM International. ASTM D8197-22, Standard Specification for Maintaining Acceptable Water Activity (aw) Range (0.55 to 0.65) for Dry Cannabis Flower Intended for Human/Animal Use.
- Beuchat LR (1983). Influence of water activity on growth, metabolic activities and survival of yeasts and molds. Journal of Food Protection 46(2):135–141.
- California Code of Regulations, Title 4, § 15717. Moisture content and water activity testing. Department of Cannabis Control.
- Das PC, Vista AR, Tabil LG, Baik OD (2022). Postharvest operations of cannabis and their effect on cannabinoid content: a review. Bioengineering 9(8):364.
- Milay L, Berman P, Shapira A, Guberman O, Meiri D (2020). Metabolic profiling of cannabis secondary metabolites for evaluation of optimal postharvest storage conditions. Frontiers in Plant Science 11:583605.
- Oduola AA, Luthra K, Atungulu GG (2022). Determination of moisture sorption isotherms of industrial hemp (Cannabis sativa L.) flower and leaf composite powders. Industrial Crops and Products 186:115201.
- Punja ZK, Collyer D, Scott C, Lung S, Holmes J, Sutton D (2019). Pathogens and molds affecting production and quality of Cannabis sativa L. Frontiers in Plant Science 10:1120.
- Punja ZK, Ni L, Lung S, Buirs L (2023). Total yeast and mold levels in high THC-containing cannabis (Cannabis sativa L.) inflorescences are influenced by genotype, environment, and pre- and post-harvest handling practices. Frontiers in Microbiology 14:1192035.
- Scott WJ (1957). Water relations of food spoilage microorganisms. Advances in Food Research 7:83–127.