

Nutrients · Yield
EC and pH for Cannabis: Chart by Stage and What Research Shows
The feed chart every grower asks for, and the part most charts leave out: controlled trials keep finding that more nutrients do not mean more yield, and often mean lower potency.
9 min read
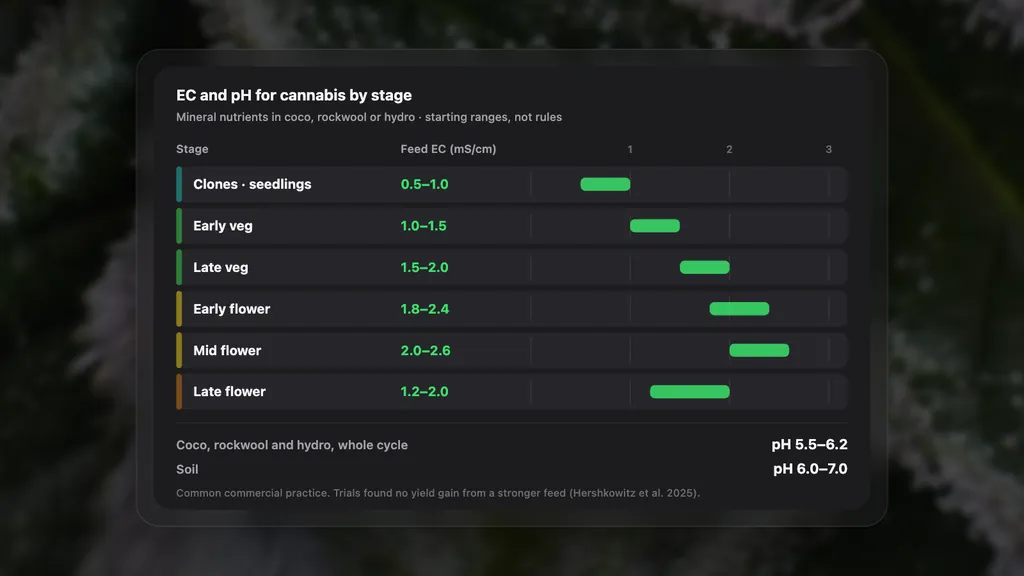
EC and pH are the two numbers growers measure most and argue about most. Feed charts from nutrient brands climb week after week, forums swear by 3.0 in peak flower, and the plant in front of you looks fine at half of that. Over the last few years controlled trials on drug-type cannabis have put numbers on what the plant actually uses, and they are lower than most charts.
This guide gives working ranges by stage, explains what EC and pH do and do not tell you, sums up the trials on nitrogen, phosphorus and potassium, and shows how to use runoff to see what is happening at the roots.
What EC and pH measure
Electrical conductivity (EC) measures how well a solution conducts electricity, which rises with the amount of dissolved salts. It is a total: it says how concentrated the feed is, not which nutrients are in it. Two solutions at 2.0 mS/cm can hold very different amounts of nitrogen, potassium or sodium. The unit is mS/cm, the same as dS/m.
Many meters show ppm instead. That is not a measurement but a conversion, and meters use different factors: 500 or 700 times the EC. The same solution reads 1,000 ppm on one meter and 1,400 on another, so compare in EC.
| EC (mS/cm) | ppm, 500 scale | ppm, 700 scale |
|---|---|---|
| 1.0 | 500 | 700 |
| 1.5 | 750 | 1,050 |
| 2.0 | 1,000 | 1,400 |
| 2.5 | 1,250 | 1,750 |
| 3.0 | 1,500 | 2,100 |
pH measures acidity on a logarithmic scale: a solution at pH 5 is ten times more acidic than one at pH 6. It does not feed the plant. It decides which nutrients stay dissolved and available to the roots.
EC and pH chart for cannabis by stage
These are starting ranges for mineral nutrients in coco, rockwool or other soilless media with regular runoff, drawn from common commercial practice and consistent with the trials below. They are not a recipe. Light sets the demand: a canopy at 1,000 µmol/m²/s uses far more than one at 500, as our guide to PPFD and DLI explains, and transpiration decides how much solution moves through the plant, which is where the VPD chart comes in. Start at the low end of each band and move on evidence: leaf colour, runoff and, in the end, dry weight.
Source water counts. Tap water at 0.4 mS/cm already uses part of the budget, with calcium, magnesium, sodium or bicarbonate you did not choose. Measure it before mixing and build the recipe on top of it.
In living soil and organic systems the EC of the input says little, because nutrients are released by microbes over time. There the pH of the medium and the response of the plant are the useful readings.
What controlled trials found for N, P and K
Nitrogen. In a trial with five nitrogen levels from 30 to 320 mg/L in flower, yield rose up to 160 mg/L and did not change beyond it (Saloner and Bernstein, 2021). A response-surface study in deep-water culture predicted the highest yield at 194 mg/L (Bevan et al., 2021).
Phosphorus. At 15 mg/L or less plants were clearly deficient; from 30 to 90 mg/L they developed equally well, and 30 mg/L was enough for 80% of the maximum yield (Shiponi and Bernstein, 2021). The response-surface study put the optimum at 59 mg/L (Bevan et al., 2021). In a third trial, 25, 50 and 75 mg/L gave the same flower yield and cannabinoid concentration, while tripling the phosphorus input raised phosphorus in the leachate twelve-fold (Westmoreland and Bugbee, 2022). Most of the extra phosphorus in a bloom booster leaves through the drain.
Potassium. At 15 mg/L plants were chlorotic and yielded less; from 60 to 175 mg/L function and yield were optimal, and at 240 mg/L one of the two cultivars showed symptoms of over-supply (Saloner and Bernstein, 2022). In deep-water culture, yield did not respond to potassium anywhere between 60 and 340 mg/L (Bevan et al., 2021).
Total concentration. Doubling the nutrient solution from 2 to 4 mS/cm in closed hydroponics raised the nutrients accumulating in the solution but did not significantly increase yield or quality, and the plants showed no visible damage (Hershkowitz et al., 2025). Cannabis forgives a strong feed. It does not reward it.
More feed can mean lower potency
The same trials measured cannabinoids, and the direction is consistent. As nitrogen supply rose from 30 to 320 mg/L, the THCA and CBDA concentrations in the flowers fell by 69% and 63% (Saloner and Bernstein, 2021). Phosphorus above the lowest level reduced THCA and CBDA concentrations by up to 25%, in line with a dilution effect: more biomass, with the cannabinoids spread through it (Shiponi and Bernstein, 2021). Most cannabinoids and terpenoids also declined as potassium rose (Saloner and Bernstein, 2022), and a higher rate of organic fertiliser in coir increased yield while diluting THC (Caplan et al., 2017).
That does not make starving the plants a strategy: at deficient levels yield collapsed, and in the phosphorus trial the total cannabinoids per plant still increased with supply. The point is that there is a level where yield has reached its plateau and concentration has not been diluted further. The authors put it at 160 mg/L for nitrogen and 60 mg/L for potassium. Feeding beyond the plateau costs nutrients, and can cost quality, for no extra weight.
pH: keeping nutrients available
Roots can only take up what is dissolved. In soilless media and hydroponics the usual window is pH 5.5 to 6.5 (Bugbee, 2004). Towards the top of it and above, iron, manganese, zinc and copper become less available and phosphate starts to precipitate with calcium: pale new growth with green veins at high pH is usually iron that the plant cannot reach, not iron missing from the tank. At the bottom, calcium and magnesium uptake suffers (Sonneveld and Voogt, 2009).
The cannabis trials are a useful reference for what works. Their solutions were all held between pH 5.5 and 6.2: at 5.6, 5.7, 5.8 ± 0.2, 5.5 to 6.0 and 5.8 to 6.2 in five soilless and hydroponic studies.
pH also moves by itself, because plants change the root zone as they take up nutrients. In a hydroponic flowering trial the solution drifted up by about 0.2 pH units a day early in flower and slowly down later on (Yep et al., 2020). A small swing inside the window is harmless. A reading that keeps leaving the window needs a cause, not just more pH-down.
Soil buffers pH and holds nutrients differently, which is why soil growers aim higher, at about 6.0 to 7.0, and correct slowly.
Read the runoff, not only the feed
The EC you mix is not the EC at the roots. When the feed is stronger than what the plants use, they take up water faster than salts, and the solution left in the pot concentrates between irrigations. Runoff is how that surplus leaves. A simple salt balance shows the relationship: what goes in is either taken up or drained.
In this model the plants take up nutrients at the equivalent of 1.6 mS/cm. A 2.0 feed with 20% runoff settles at 3.6 in the drain; the same feed with 10% runoff climbs to 5.6. Push the feed to 2.4 and 10% runoff gives 9.6. The numbers depend on the uptake you assume, but the shape does not: the less runoff, the closer the feed has to be to what the crop really uses (Sonneveld and Voogt, 2009).
- Runoff EC close to feed EC. Supply matches uptake.
- Runoff EC climbing day after day. Salts are accumulating. Lower the feed or raise the runoff; a single flush only resets the clock.
- Runoff EC below feed EC. The plants take more than they get. Raise the feed.
- Runoff pH far from feed pH. Check the medium and the roots before chasing it with acid.
Sodium and chloride deserve their own line, because plants leave most of them behind. In a flowering trial with added salt, cannabinoid concentration fell in a straight line as sodium chloride rose; the authors warn that more than 5 mM, about 290 mg/L of salt, may reduce yield and potency, and 40 mM was toxic in hydroponics (Yep et al., 2020). Softened water and some well water carry enough sodium to matter.
A measuring routine that holds up
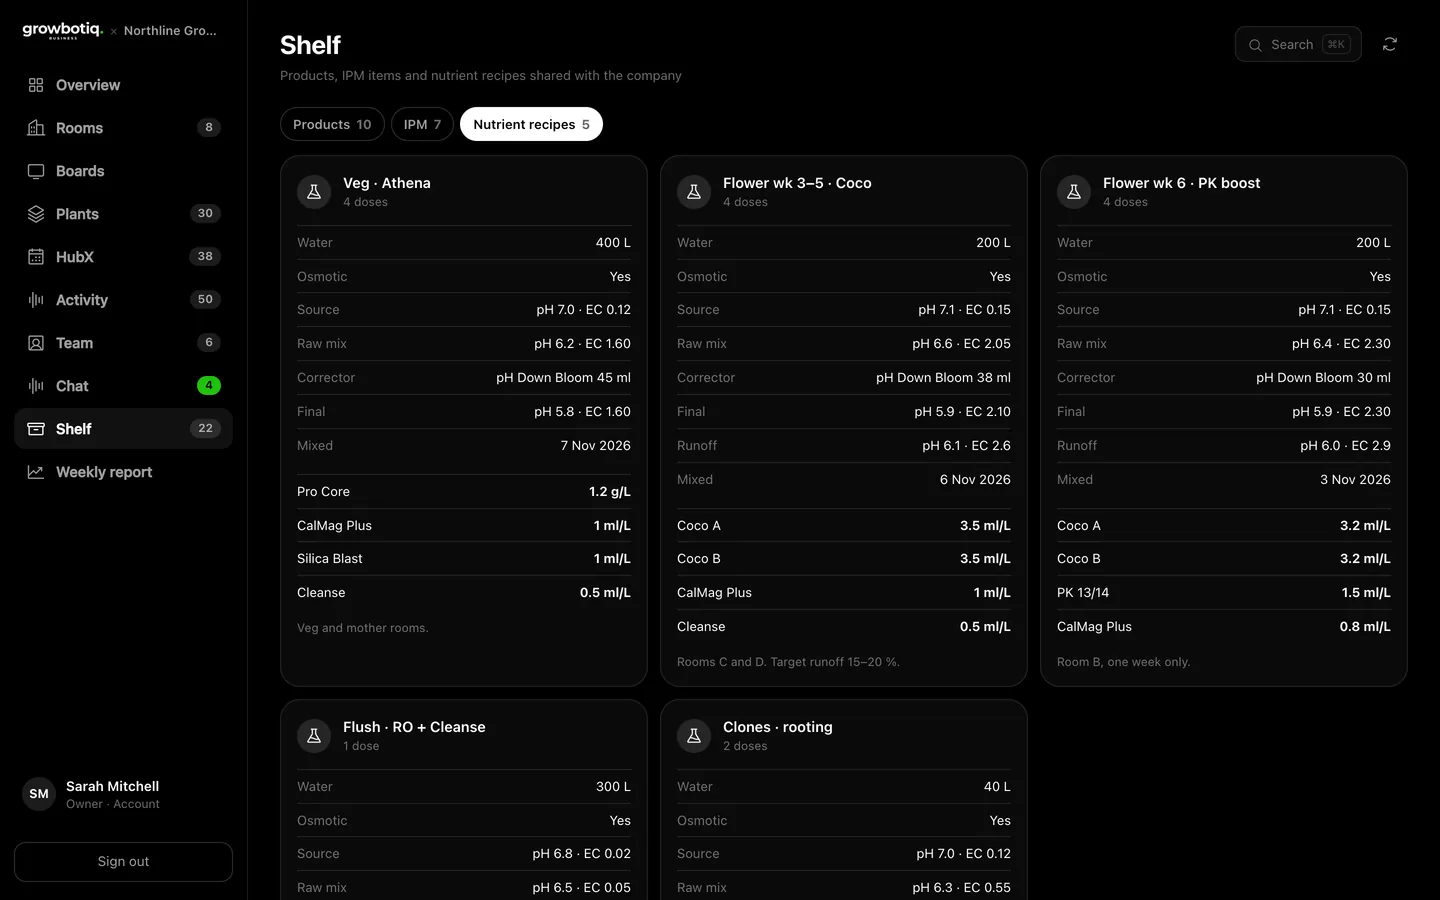
- Calibrate. Check the pH meter against fresh pH 4 and pH 7 buffers every week or two and the EC meter against a 1.413 mS/cm standard. Keep the pH probe wet, in storage solution.
- Mind the temperature. EC rises by about 2% per degree. Use a meter that compensates to 25 °C and measure solutions at room temperature.
- Keep the order. Mix the nutrients, read the EC, then adjust the pH last.
- Measure the same points. Source water, final feed and runoff, at the same irrigation of the day.
- Log it. Date, room, recipe, feed and runoff readings. A trend says more than any single number.

A feeding checklist
- Measure the EC and pH of your source water before anything else.
- Pick the band for the stage and start at its low end.
- Work out the mg/L from the label: in flower, about 160 to 190 of nitrogen, 30 to 60 of phosphorus and 60 to 175 of potassium covered full yield in trials.
- Mix, read the EC, then set the pH to 5.5–6.2 in soilless media.
- Irrigate to a steady runoff, 10 to 20% is common, and measure the EC and pH of the runoff.
- If runoff EC keeps climbing, lower the feed or raise the runoff.
- Change one thing at a time and judge it on dry weight and lab results, batch by batch.
References
- Bevan L, Jones M, Zheng Y (2021). Optimisation of nitrogen, phosphorus, and potassium for soilless production of Cannabis sativa in the flowering stage using response surface analysis. Frontiers in Plant Science 12:764103.
- Bugbee B (2004). Nutrient management in recirculating hydroponic culture. Acta Horticulturae 648:99–112.
- Caplan D, Dixon M, Zheng Y (2017). Optimal rate of organic fertilizer during the flowering stage for cannabis grown in two coir-based substrates. HortScience 52(12):1796–1803.
- Hershkowitz JA, Westmoreland FM, Bugbee B (2025). Elevated root-zone P and nutrient concentration do not increase yield or cannabinoids in medical cannabis. Frontiers in Plant Science 16:1433985.
- Saloner A, Bernstein N (2021). Nitrogen supply affects cannabinoid and terpenoid profile in medical cannabis (Cannabis sativa L.). Industrial Crops and Products 167:113516.
- Saloner A, Bernstein N (2022). Effect of potassium (K) supply on cannabinoids, terpenoids and plant function in medical cannabis. Agronomy 12(5):1242.
- Shiponi S, Bernstein N (2021). The highs and lows of P supply in medical cannabis: effects on cannabinoids, the ionome, and morpho-physiology. Frontiers in Plant Science 12:657323.
- Sonneveld C, Voogt W (2009). Plant Nutrition of Greenhouse Crops. Springer, Dordrecht.
- Westmoreland FM, Bugbee B (2022). Sustainable cannabis nutrition: elevated root-zone phosphorus significantly increases leachate P and does not improve yield or quality. Frontiers in Plant Science 13:1015652.
- Yep B, Gale NV, Zheng Y (2020). Aquaponic and hydroponic solutions modulate NaCl-induced stress in drug-type Cannabis sativa L. Frontiers in Plant Science 11:1169.